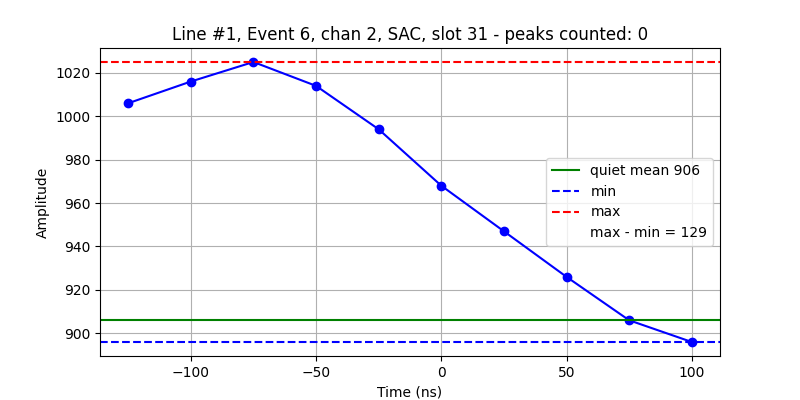
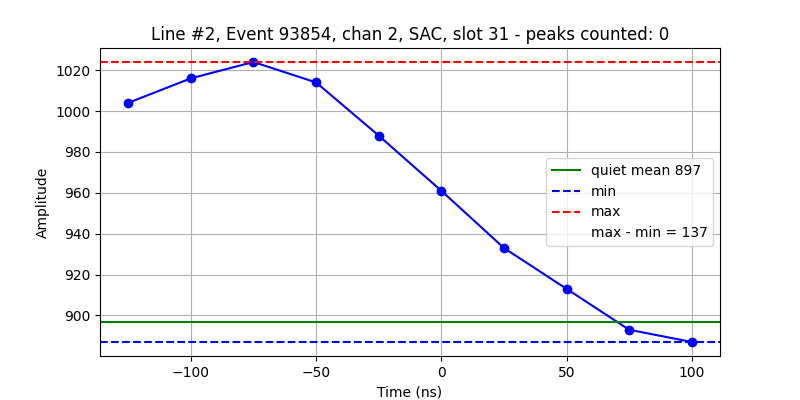
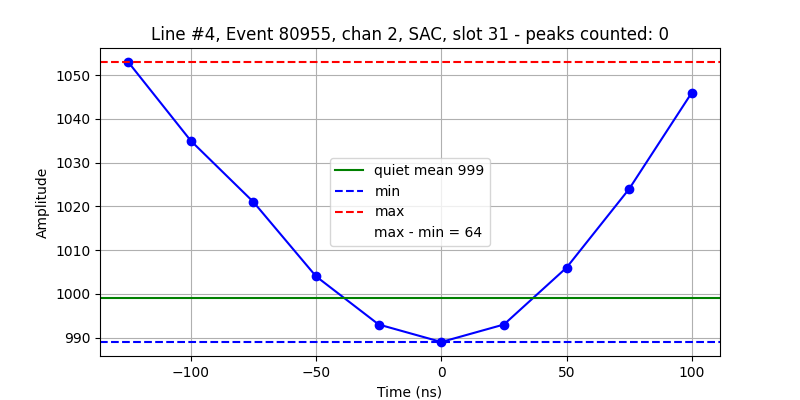
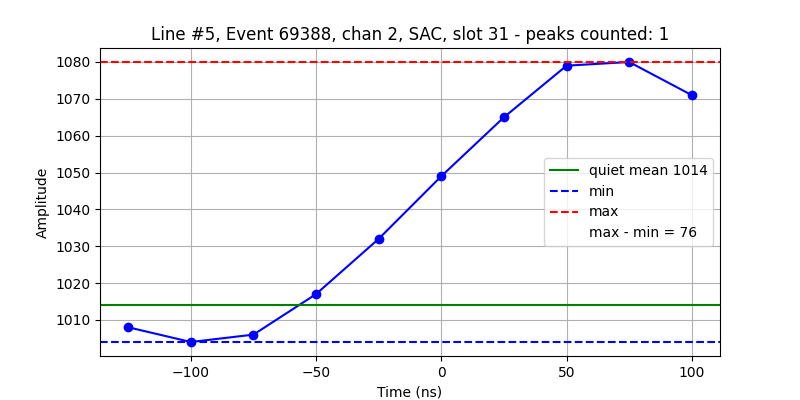
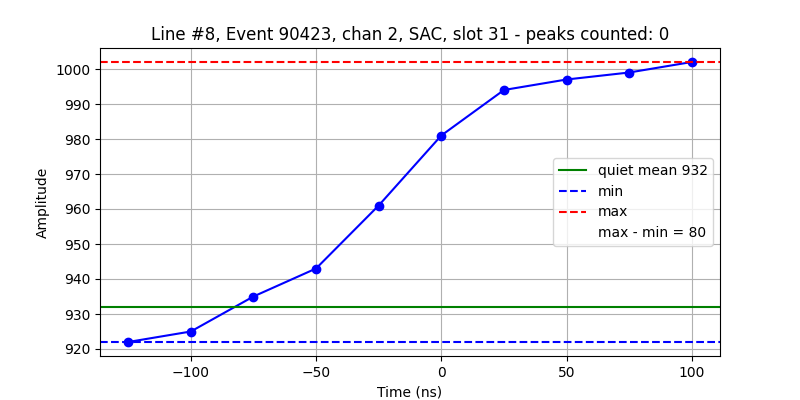
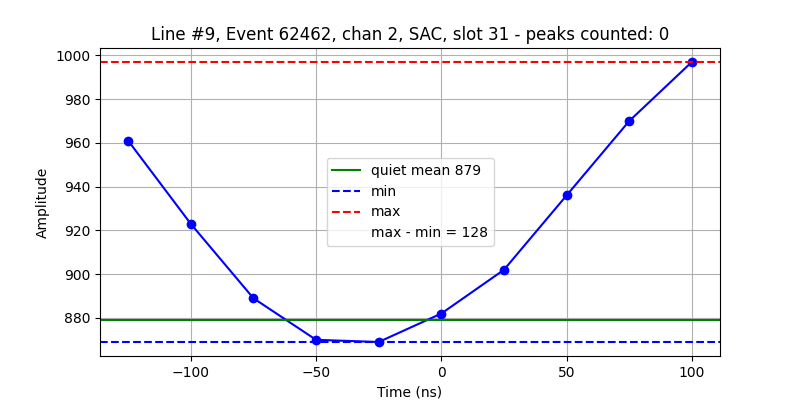

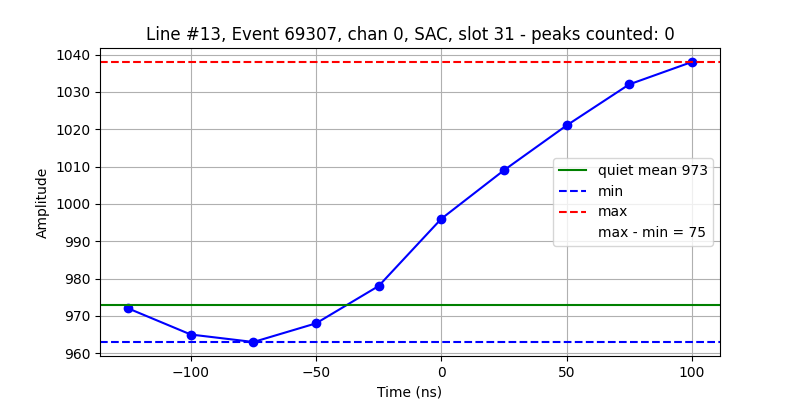
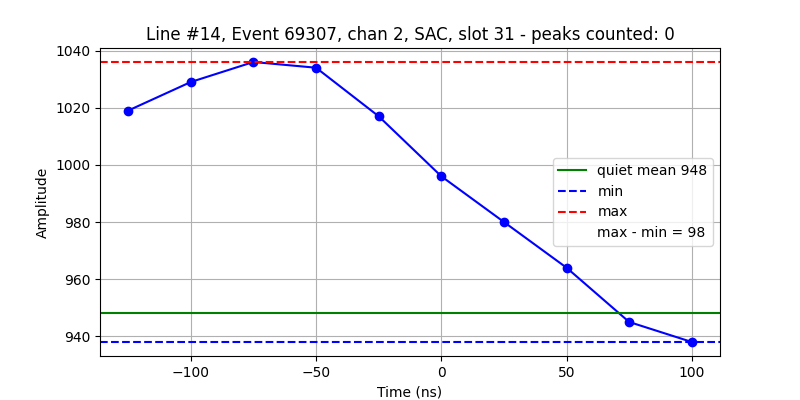
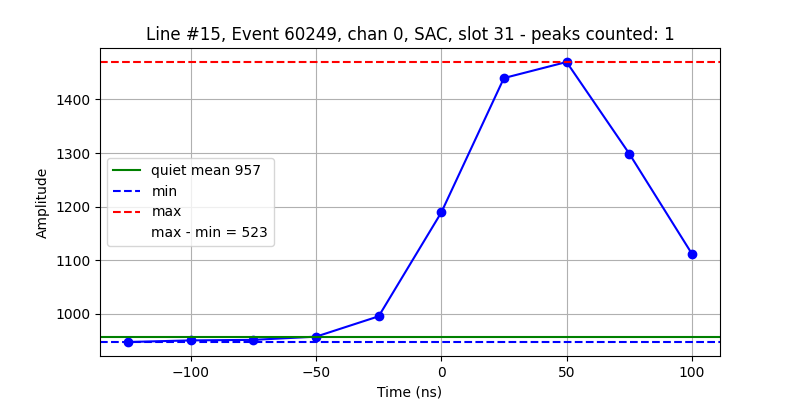
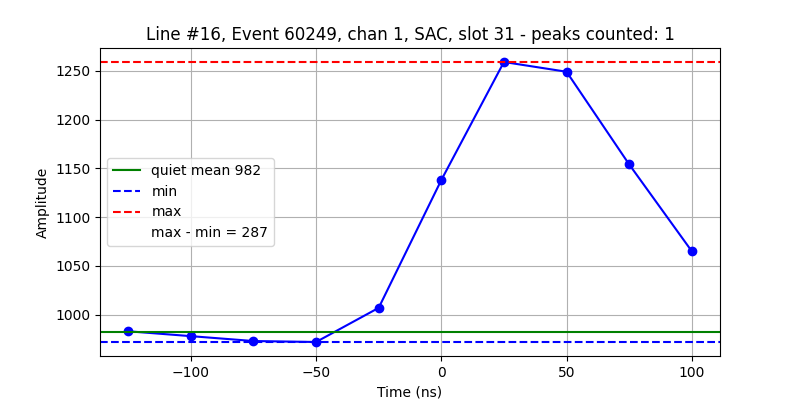
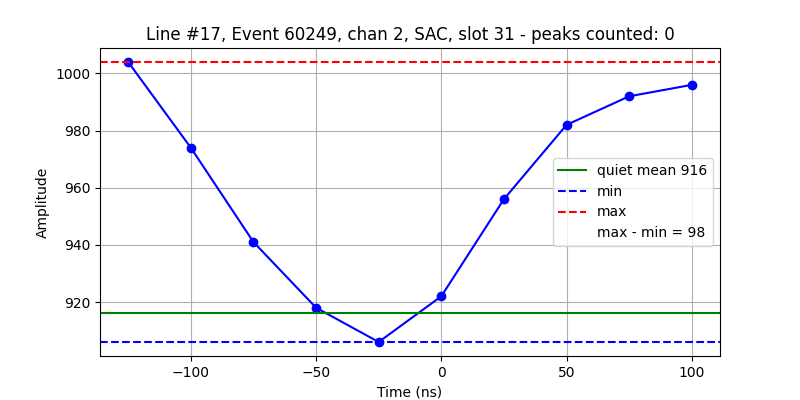
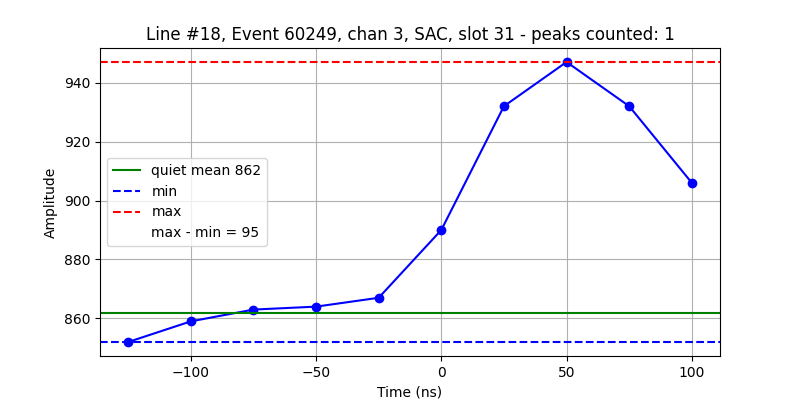
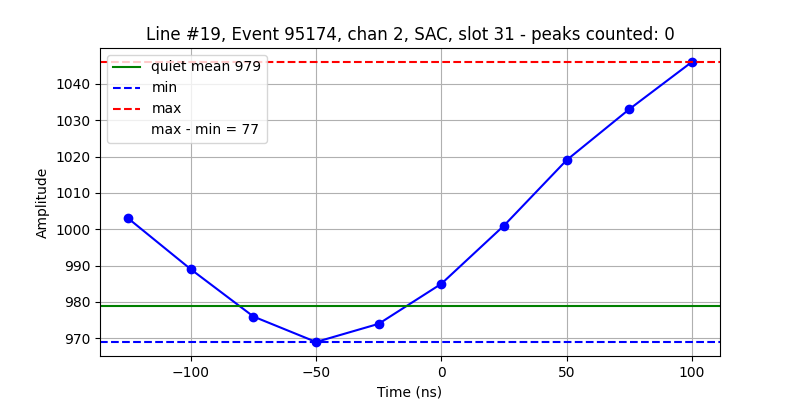

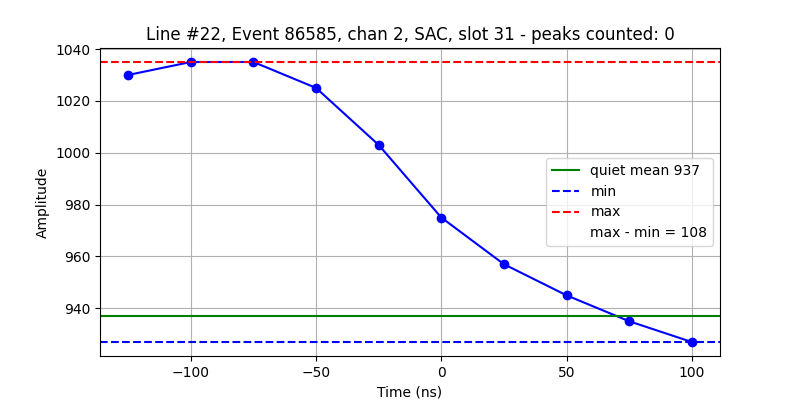
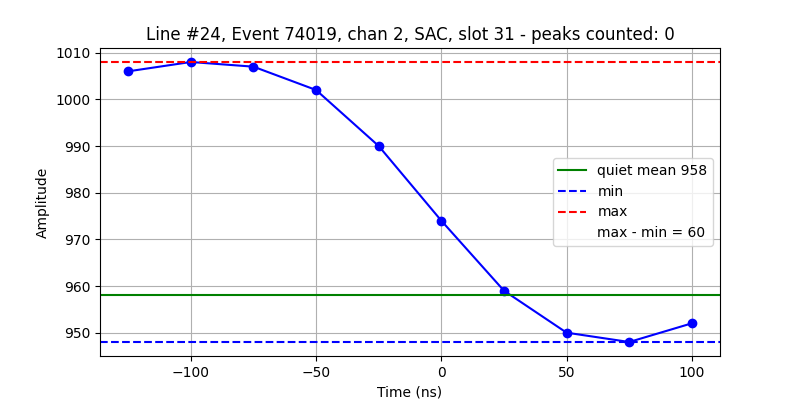
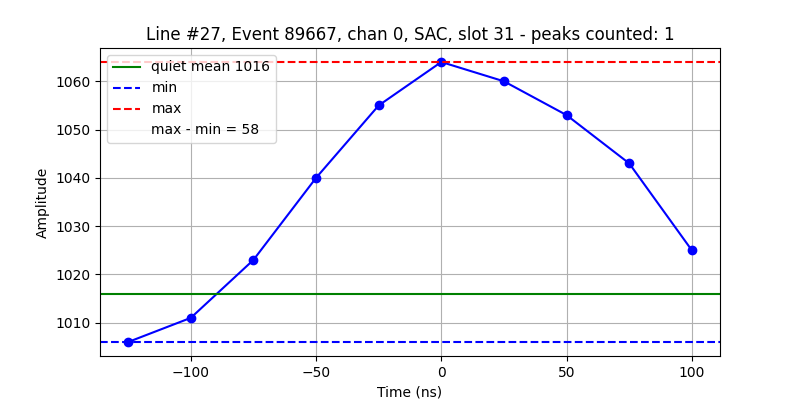
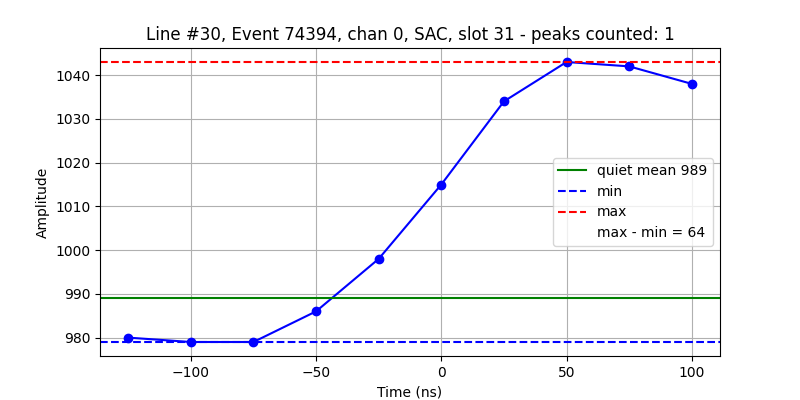

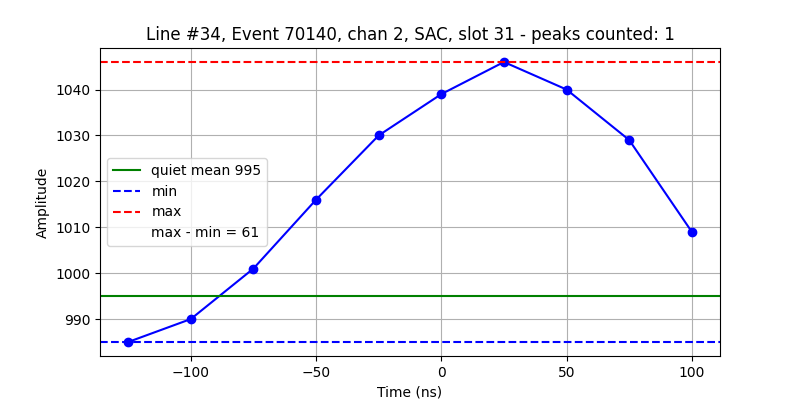
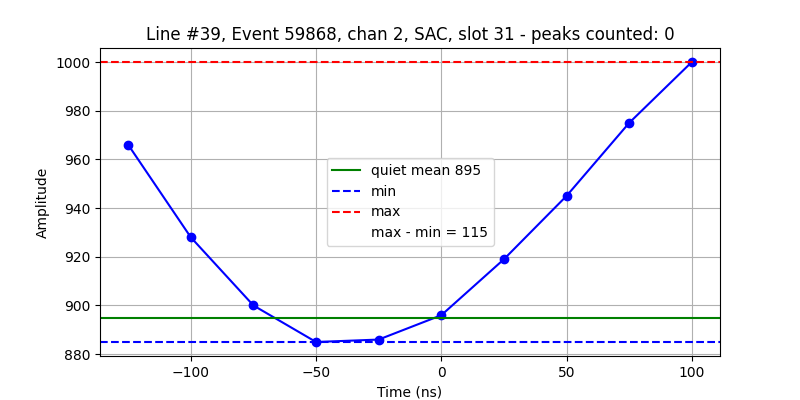
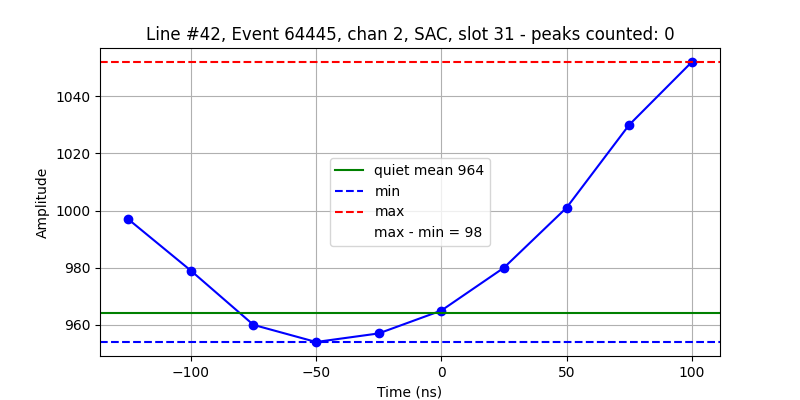
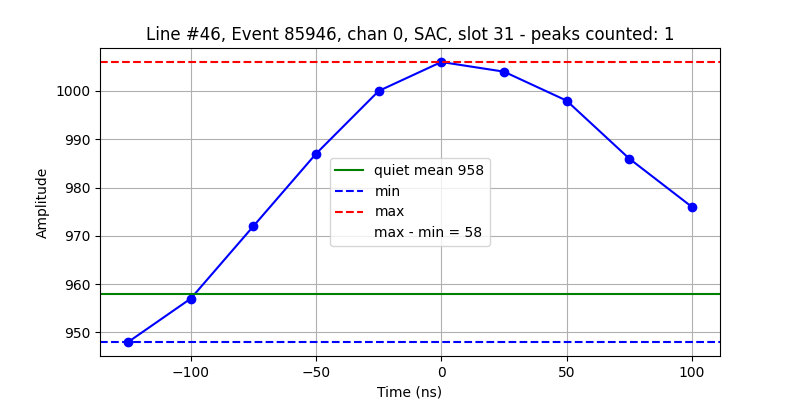
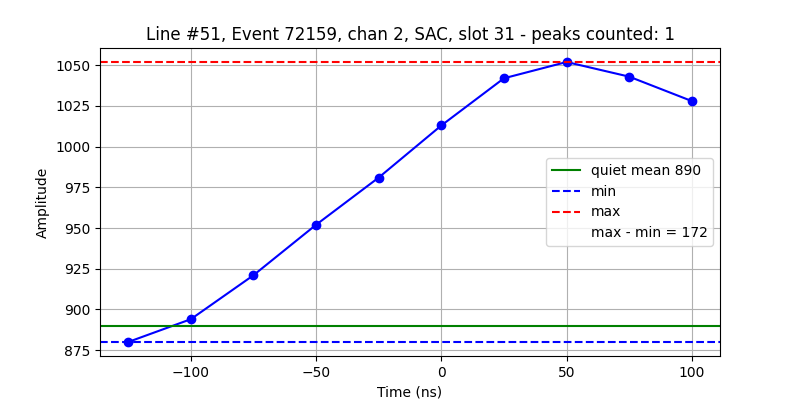
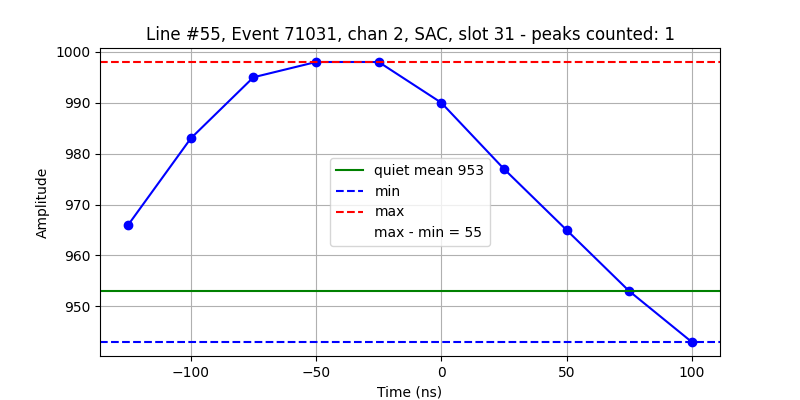
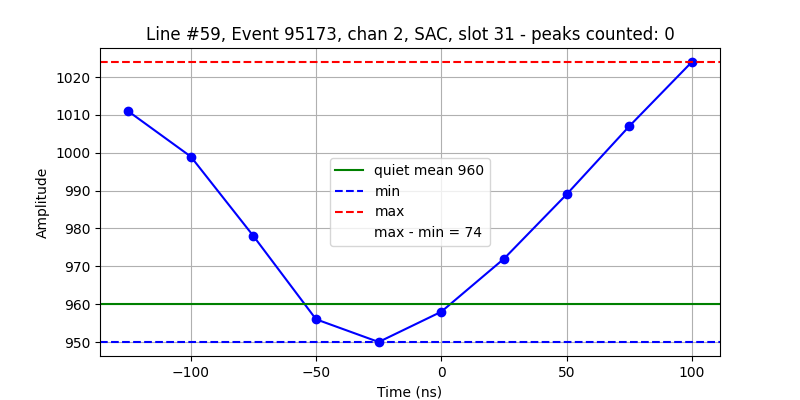
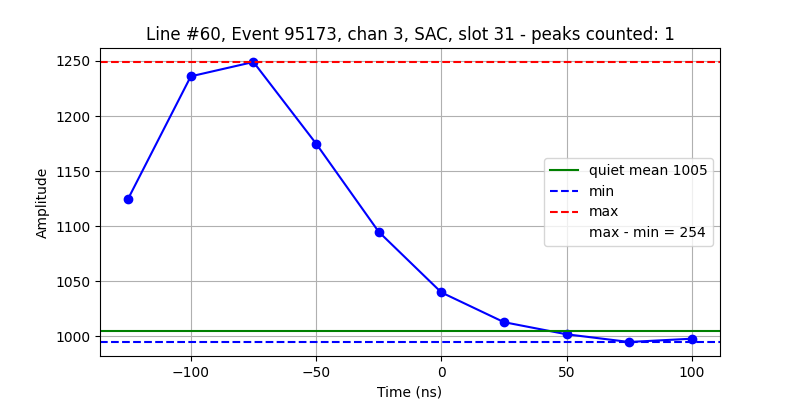
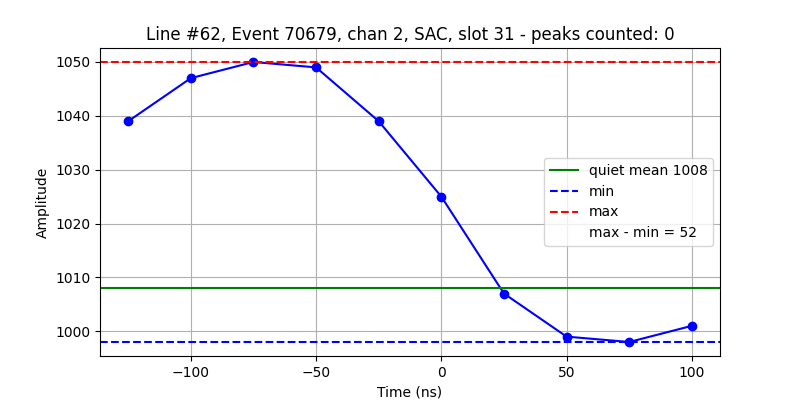
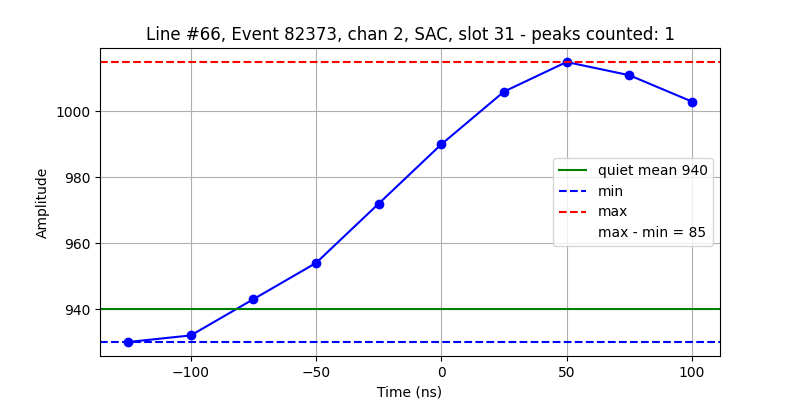
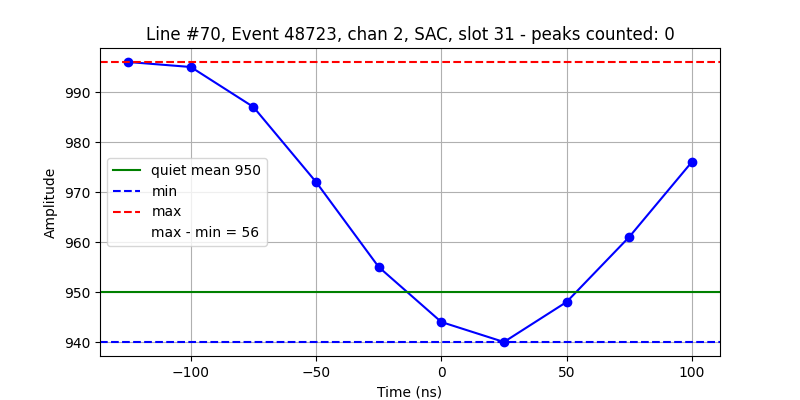
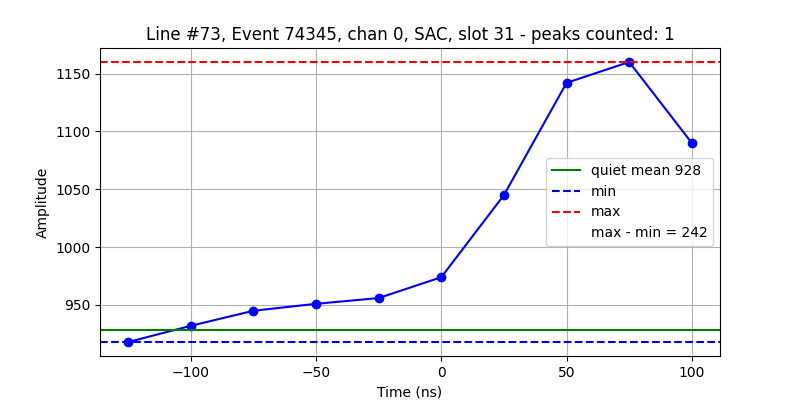
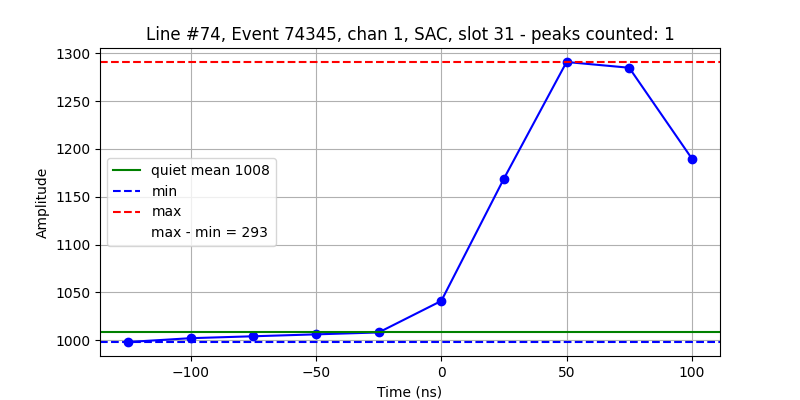
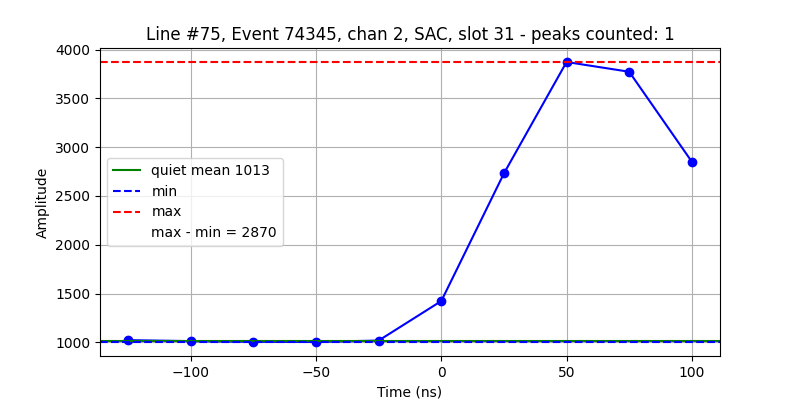

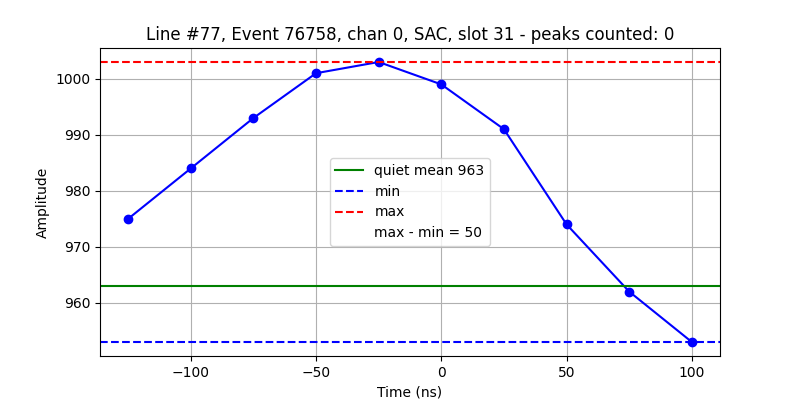
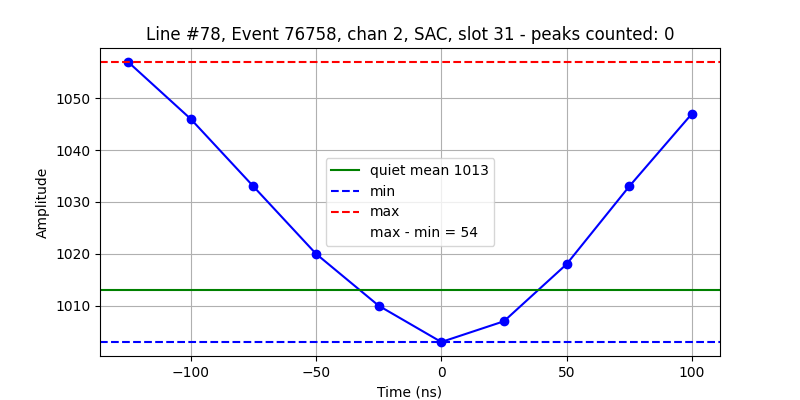
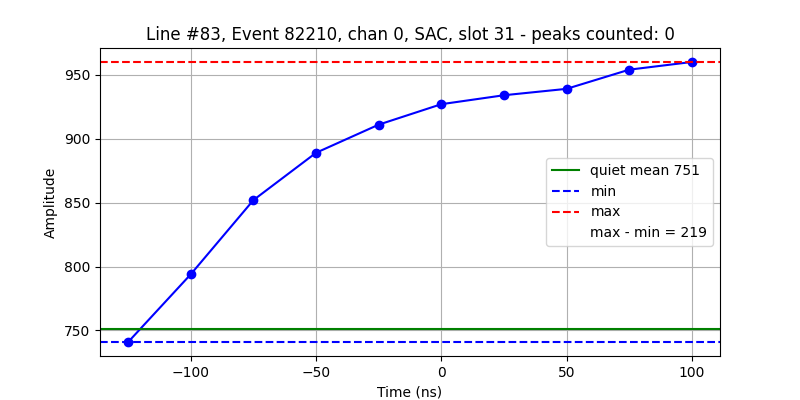
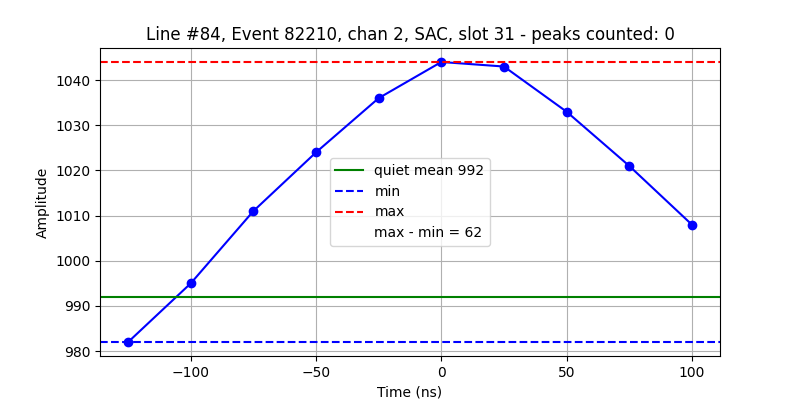
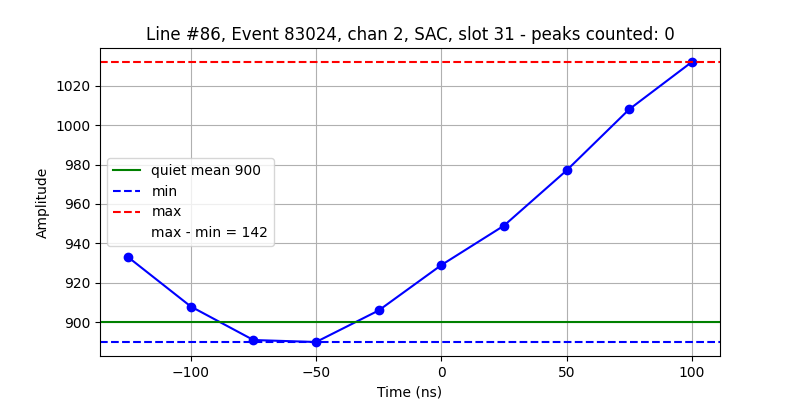
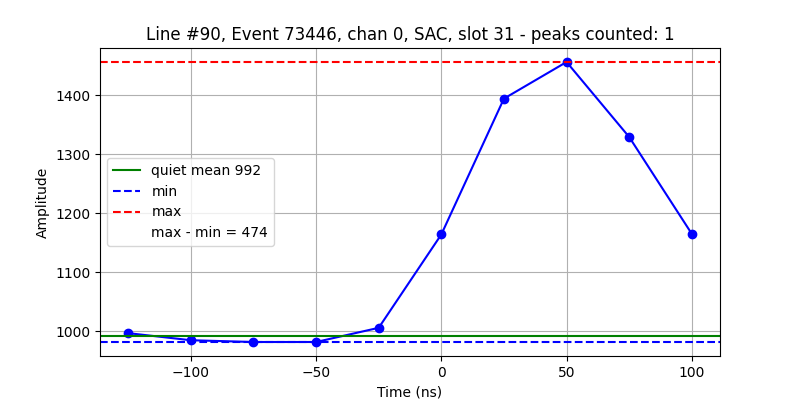
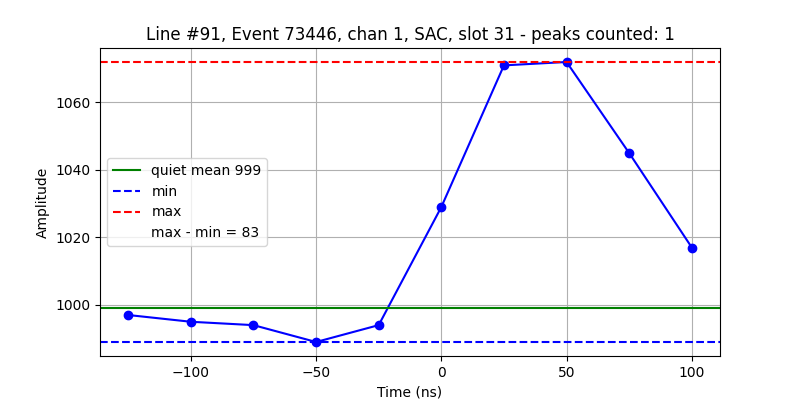
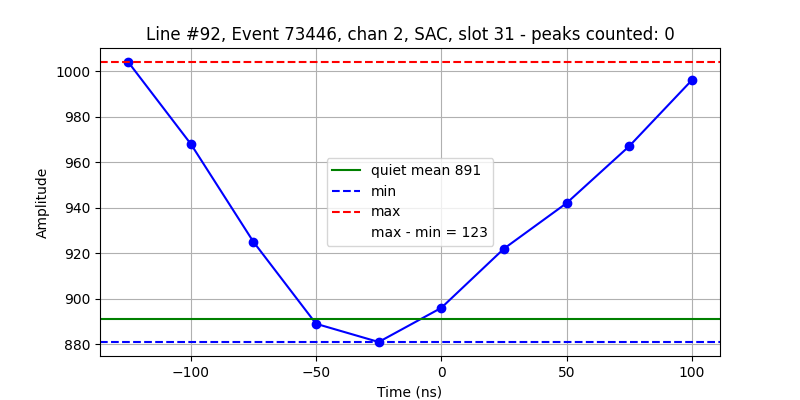
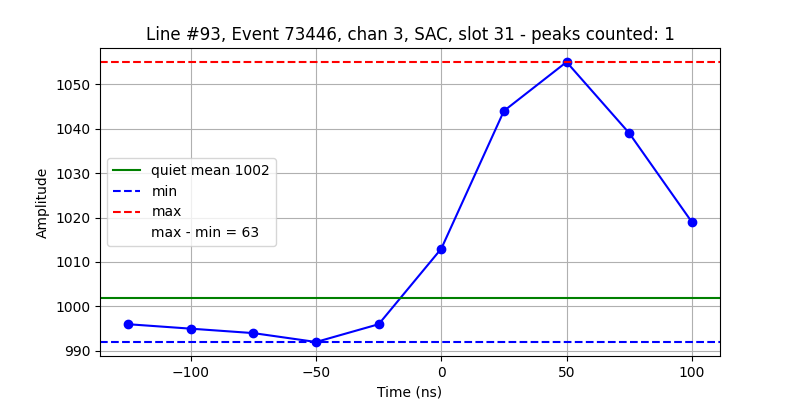
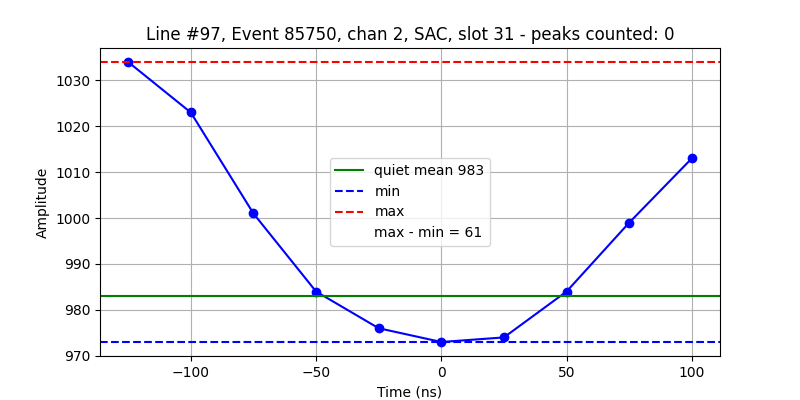
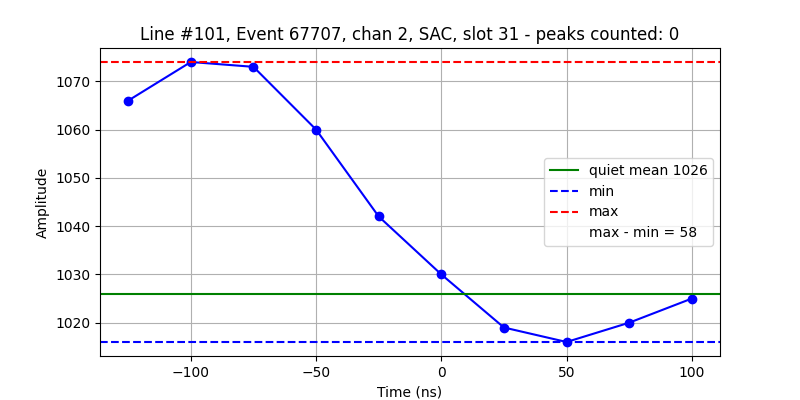
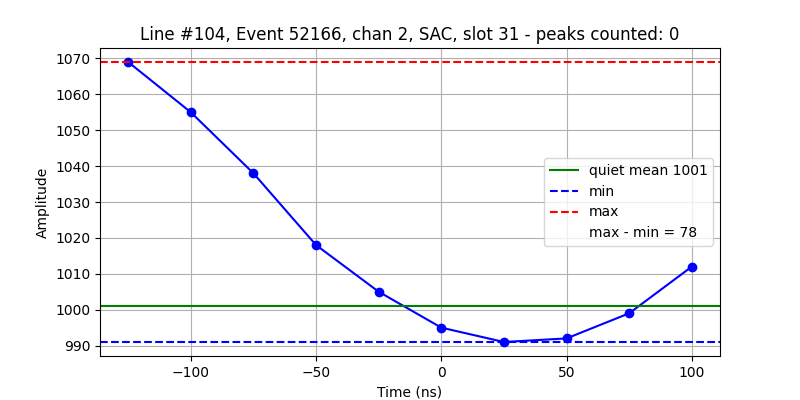
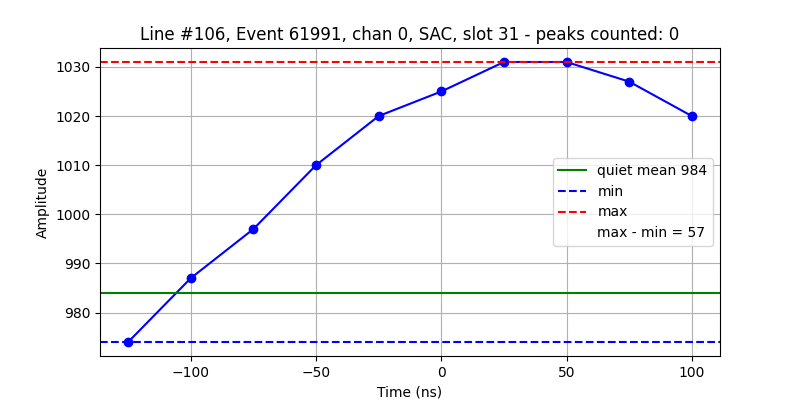

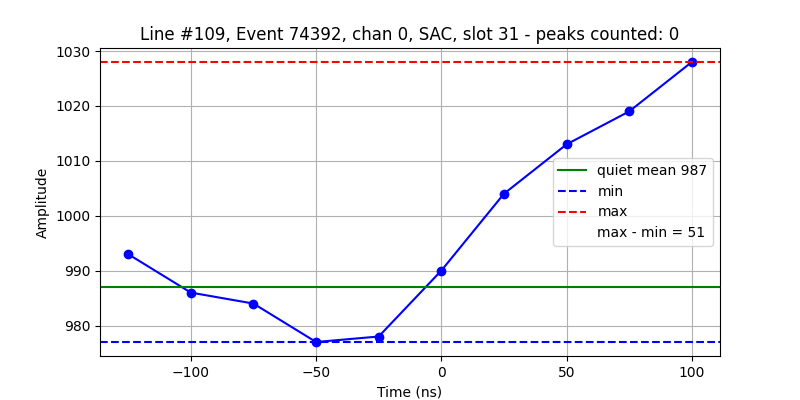
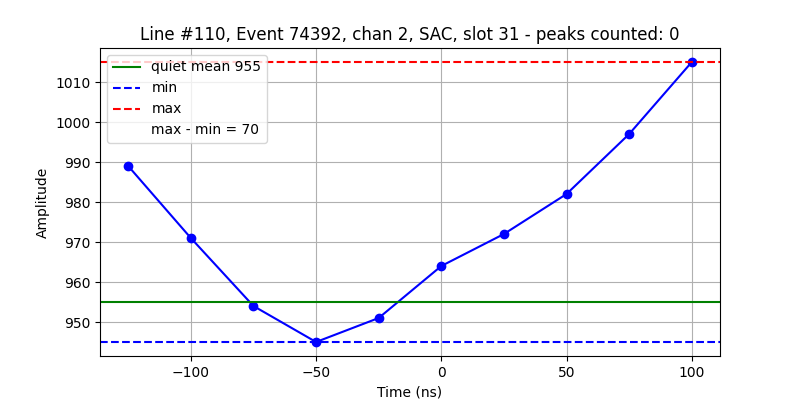

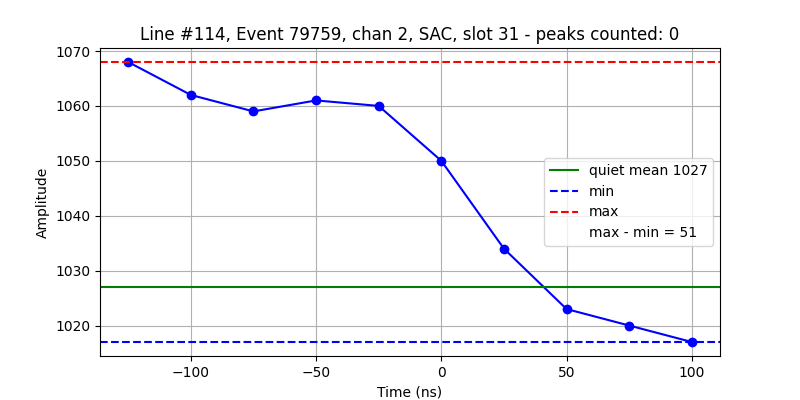
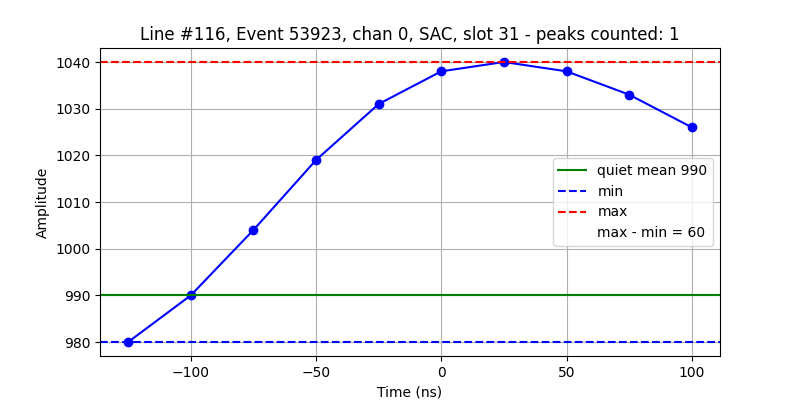


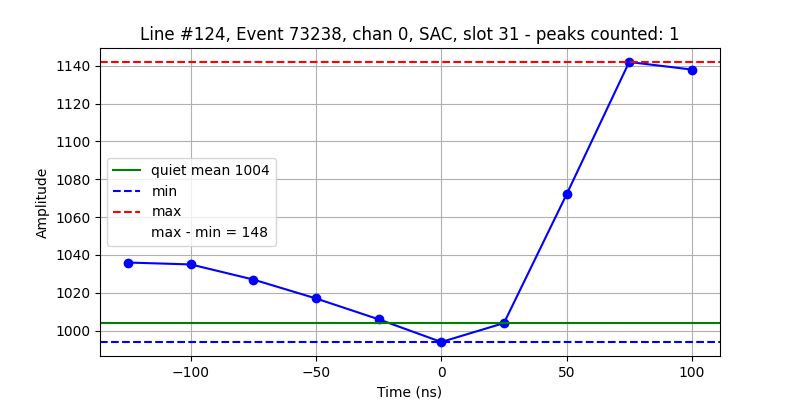
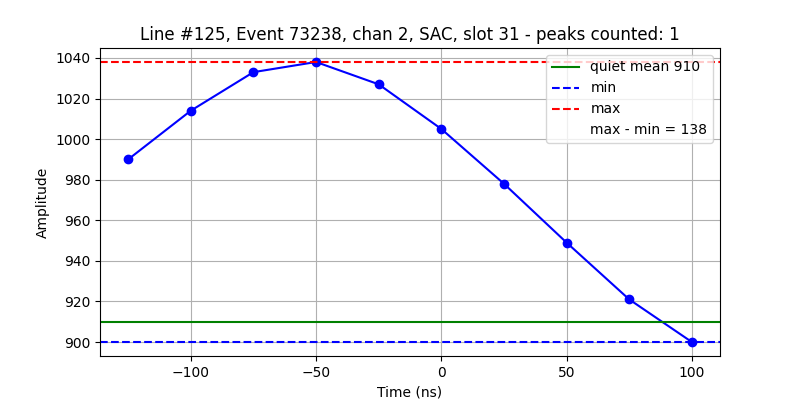
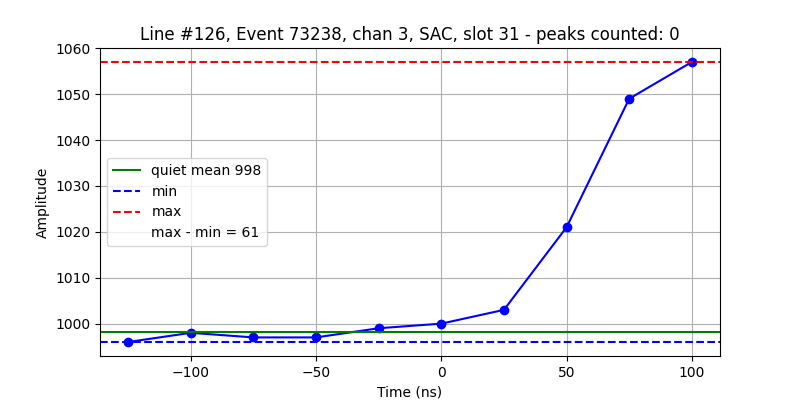
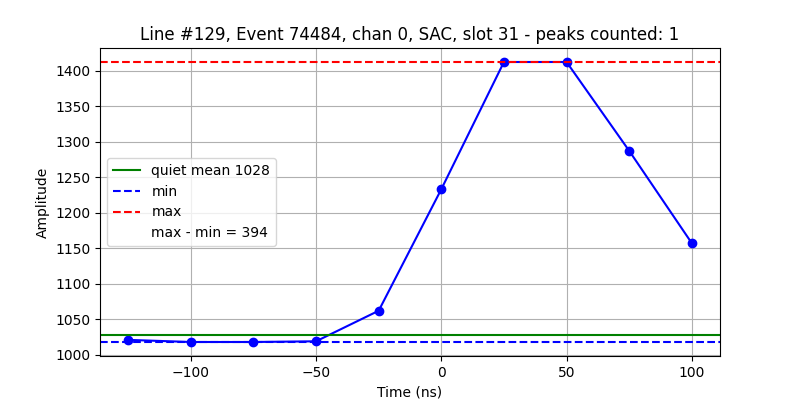
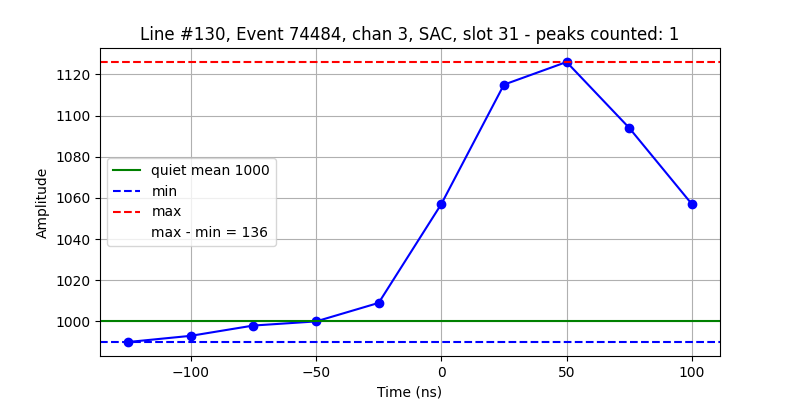
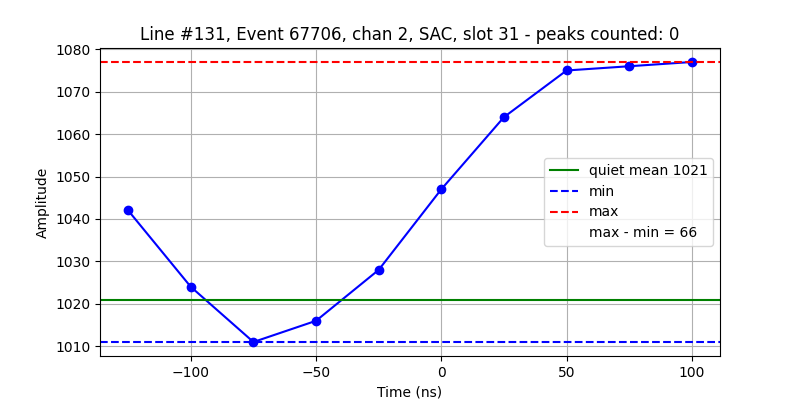
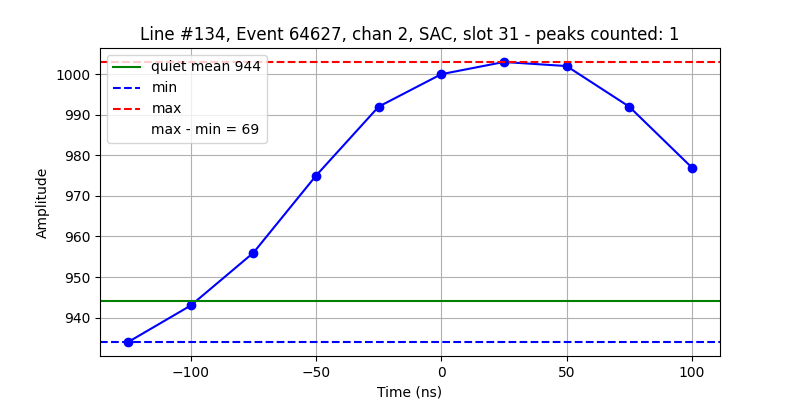
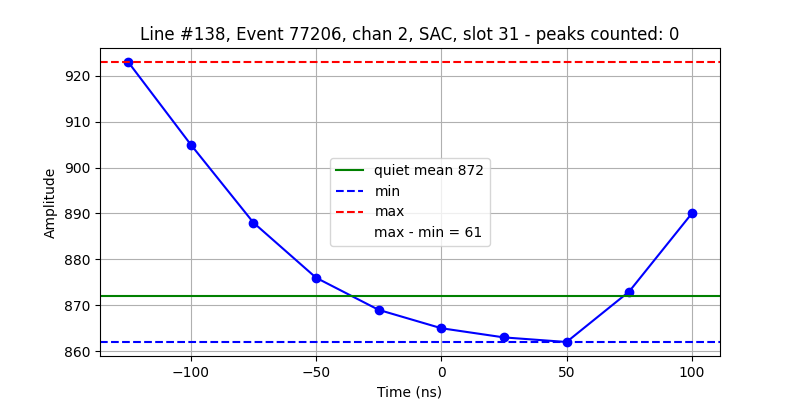
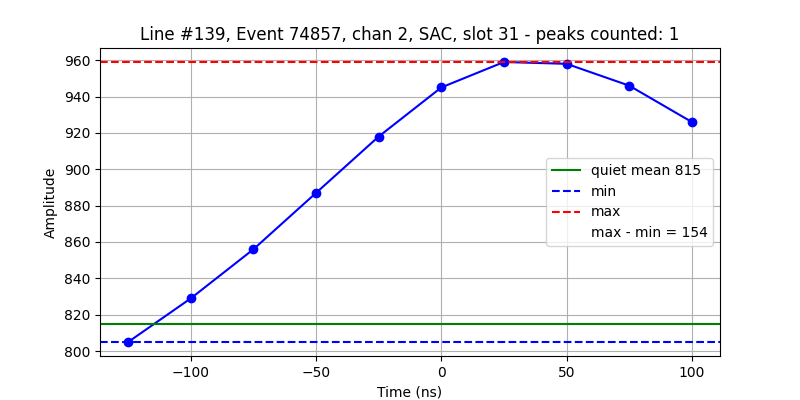
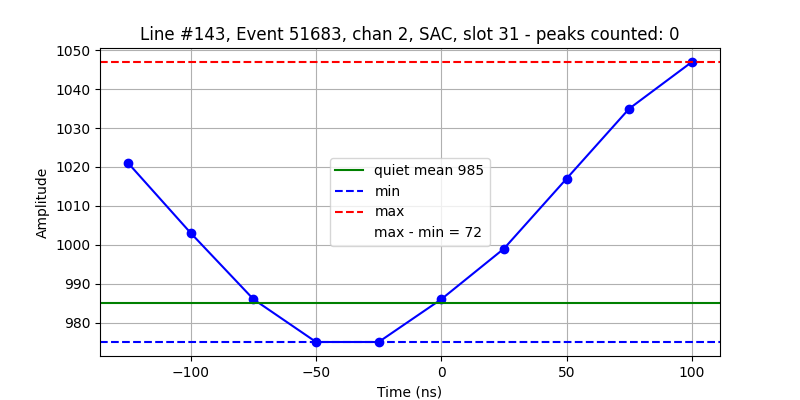
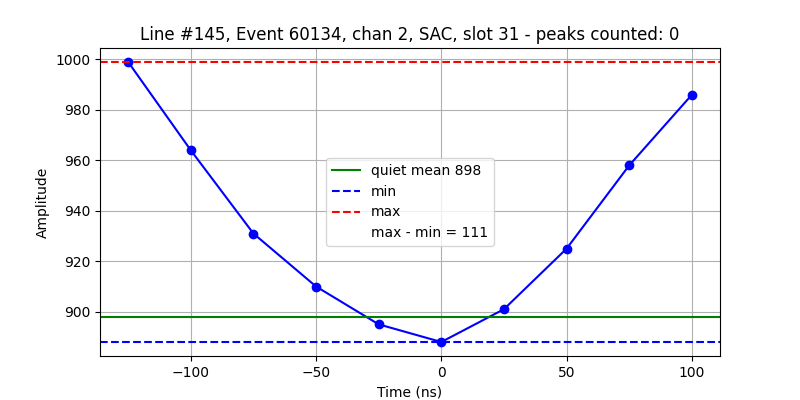
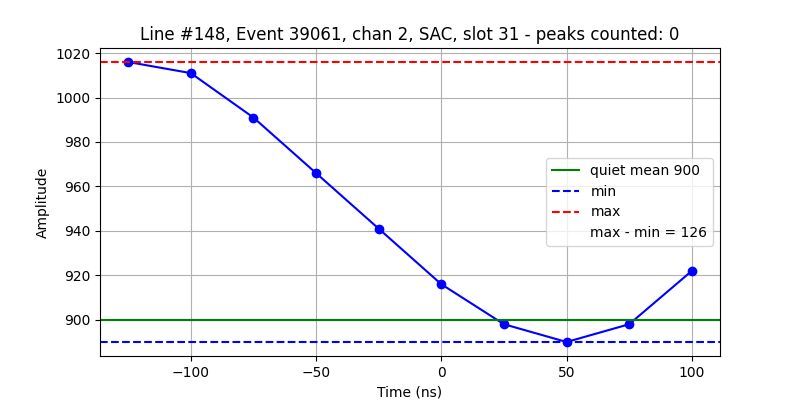
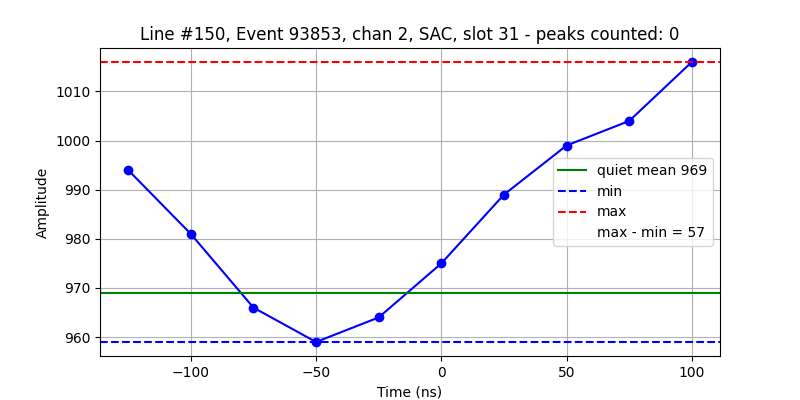
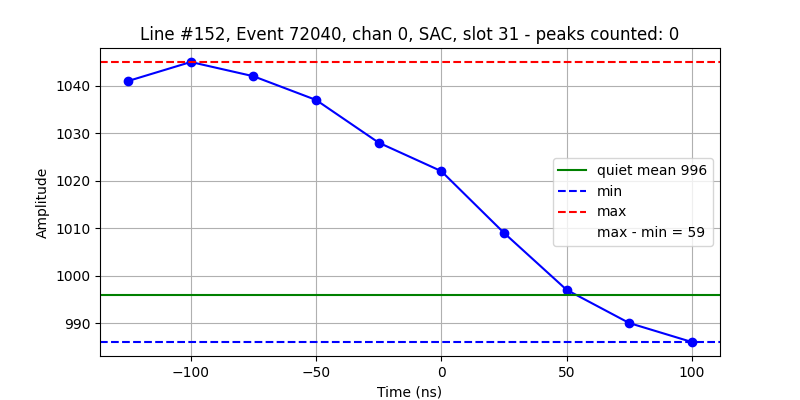
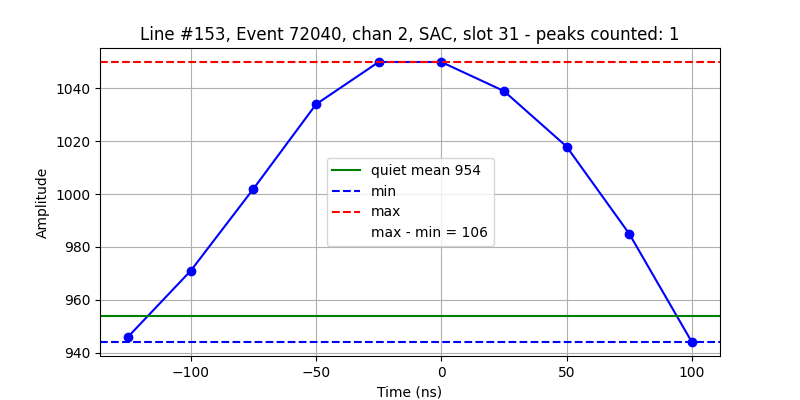
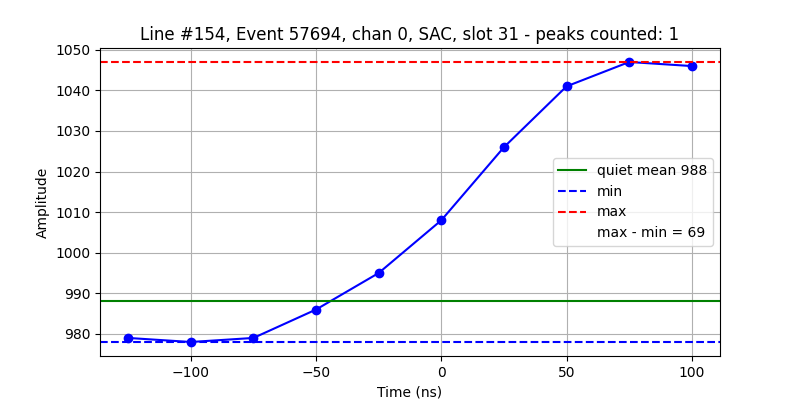
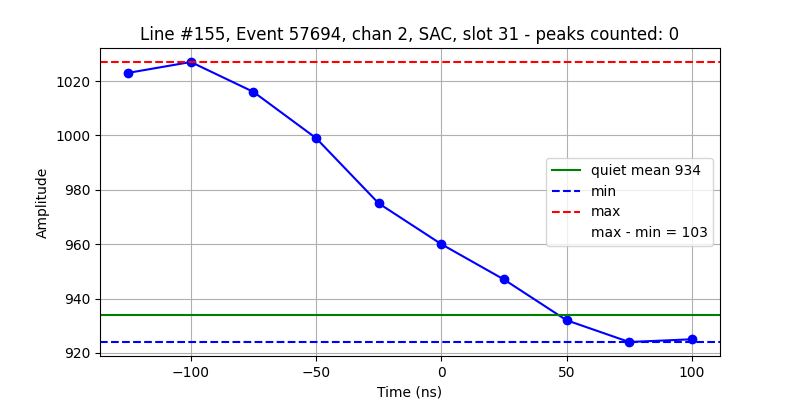
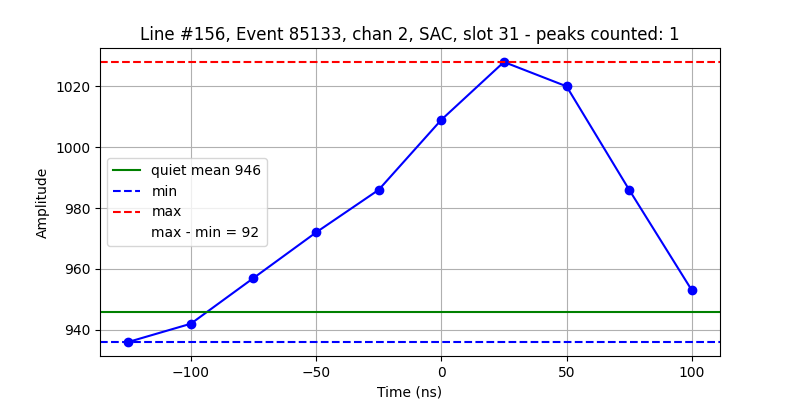
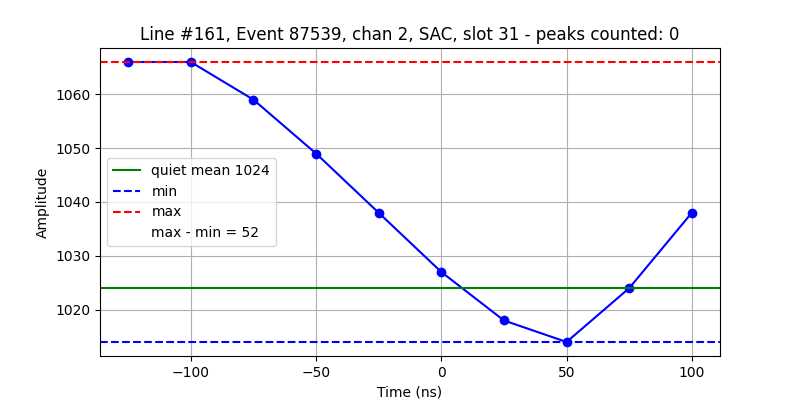
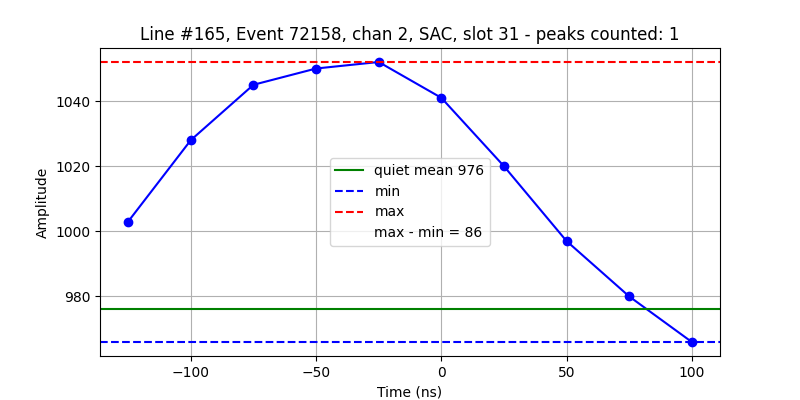
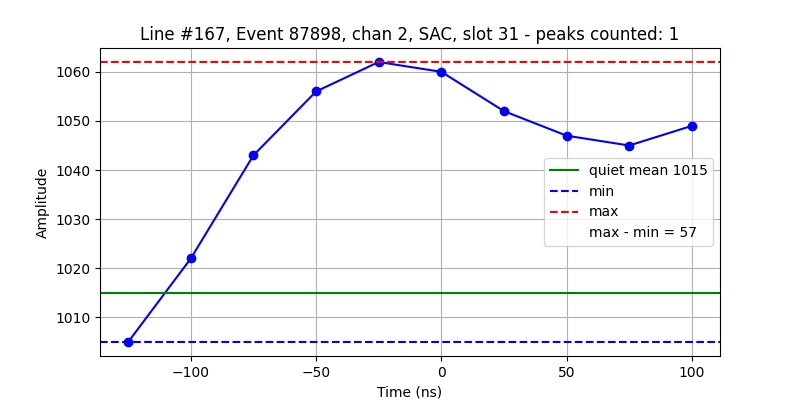

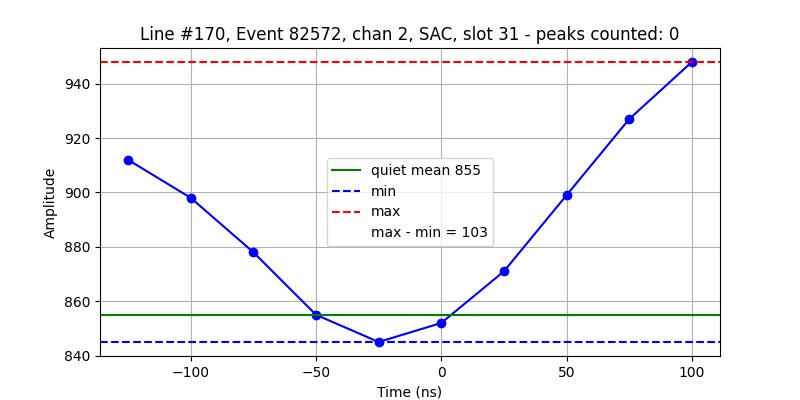
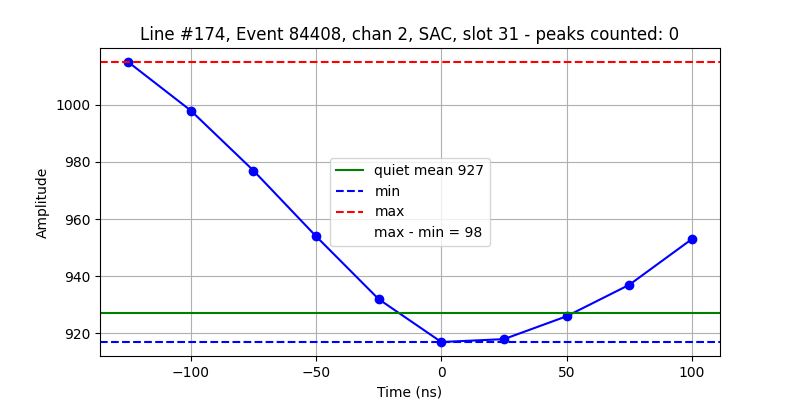
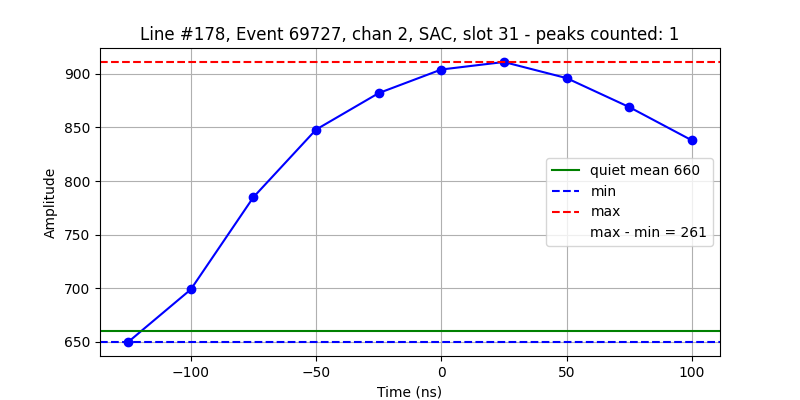
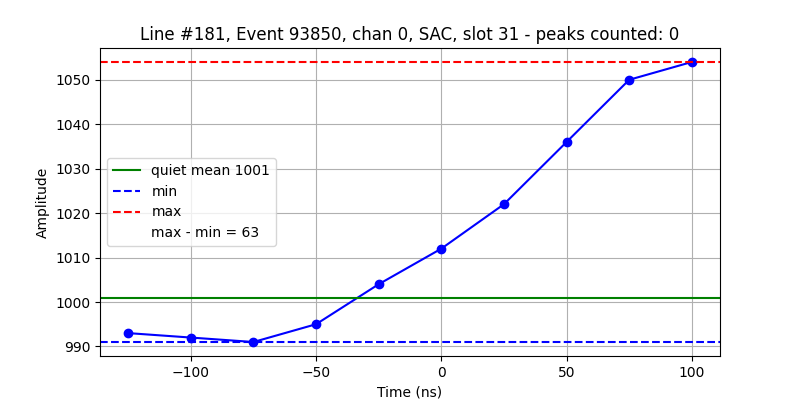
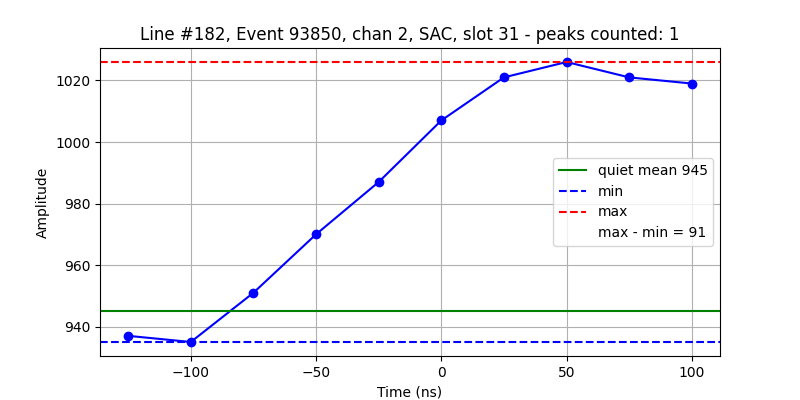

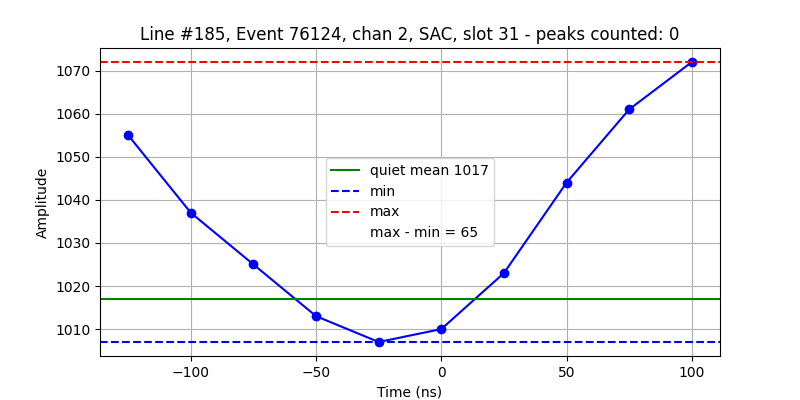
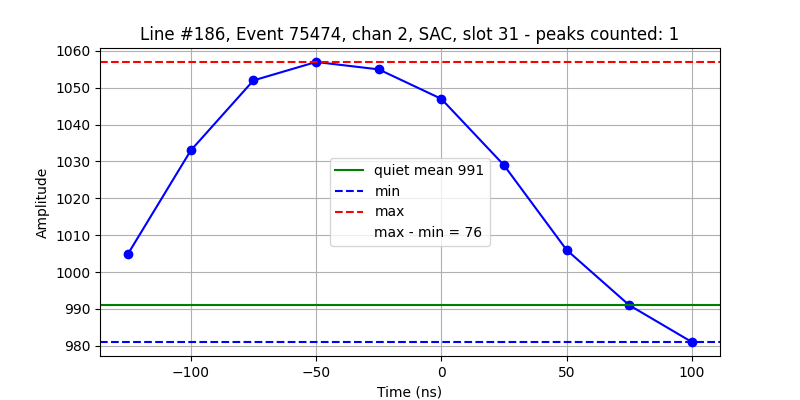
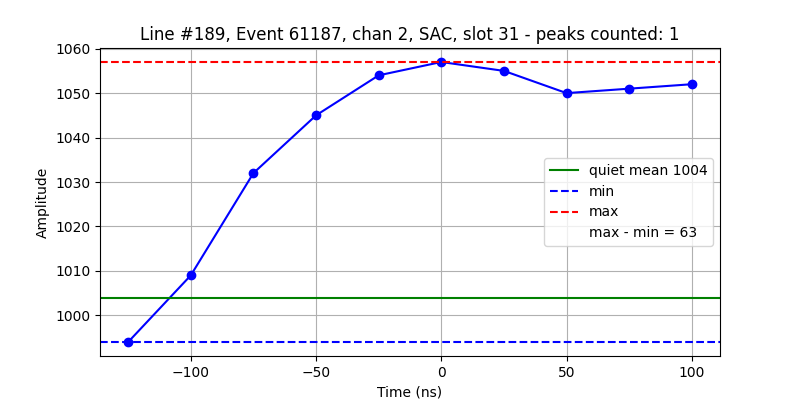
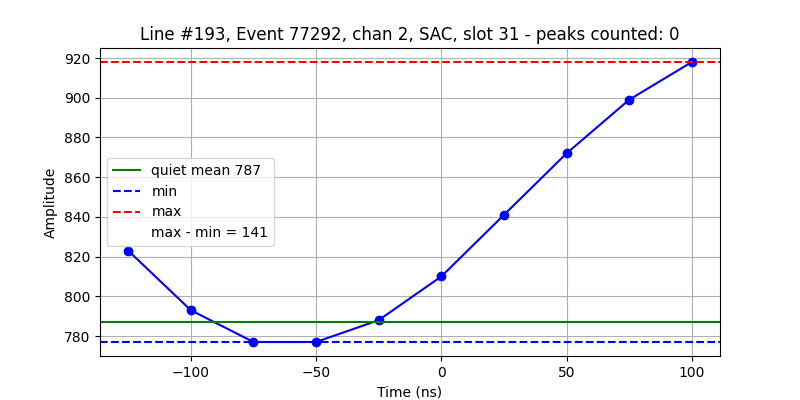
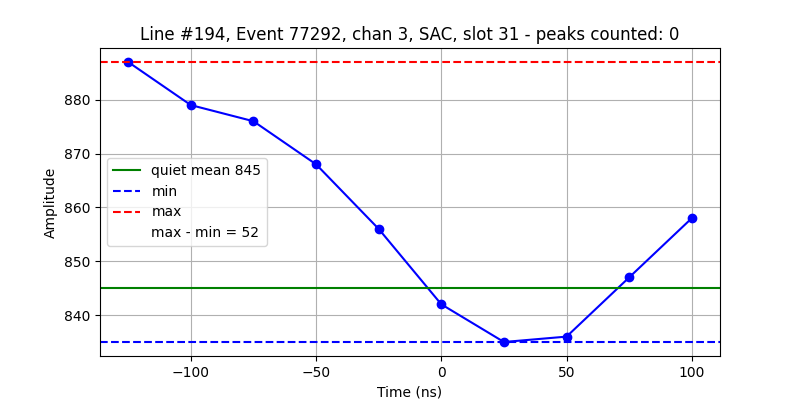
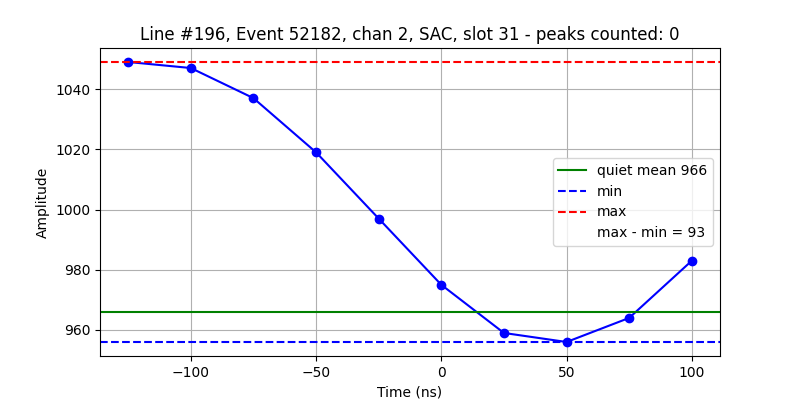
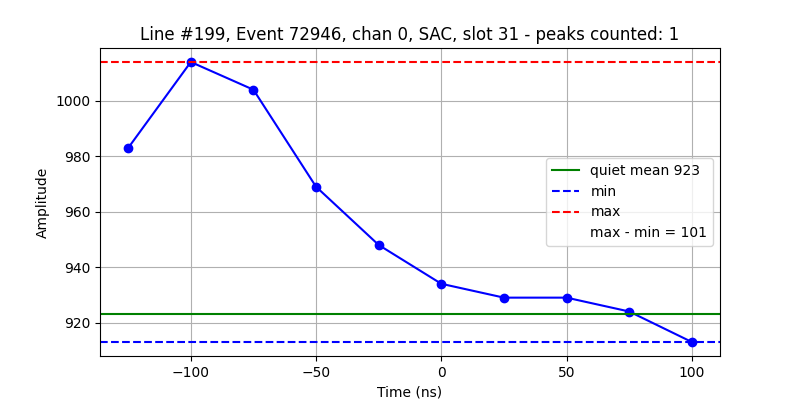
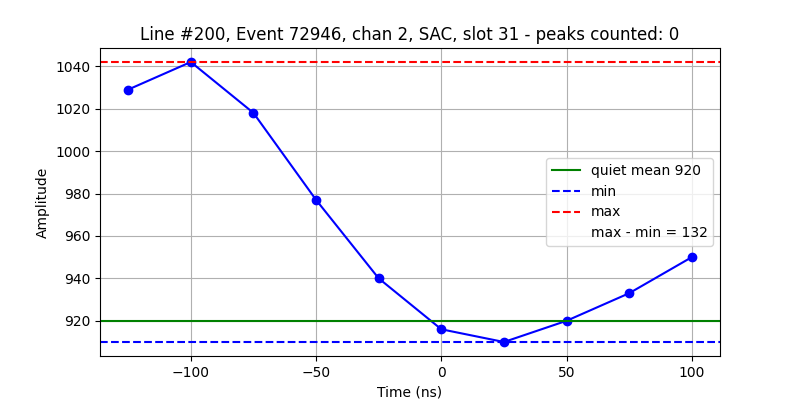
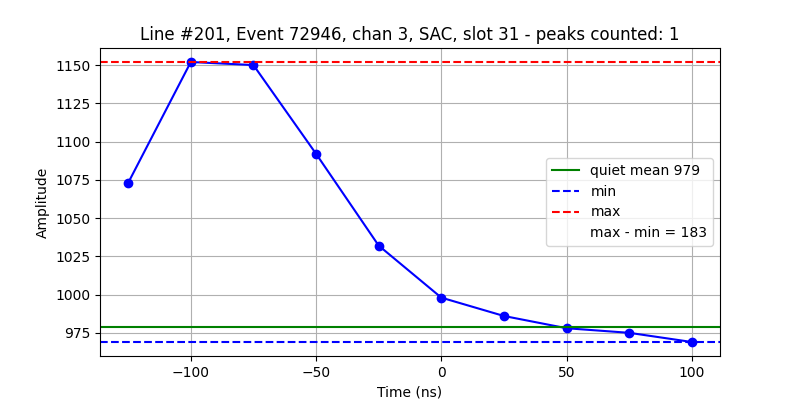

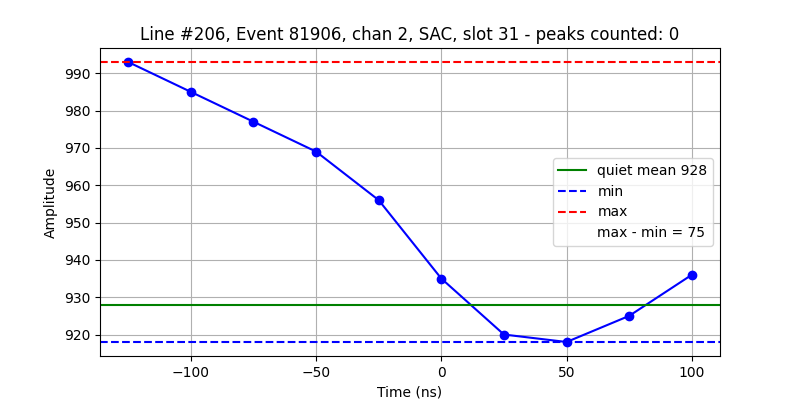
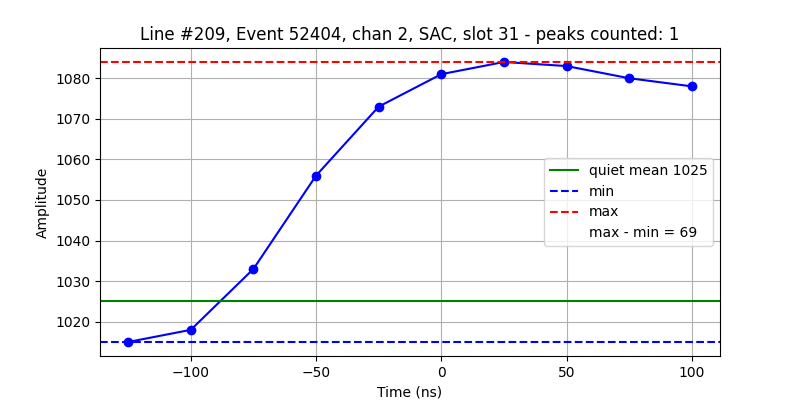
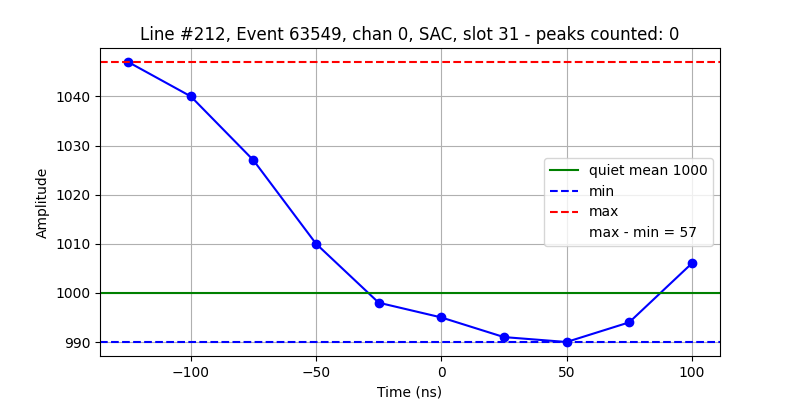
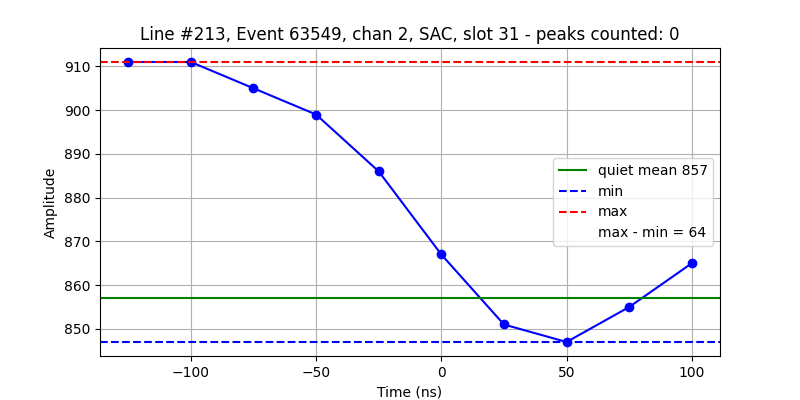
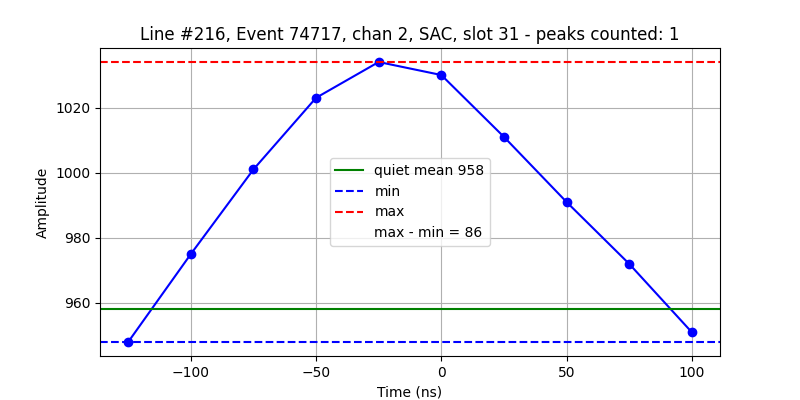
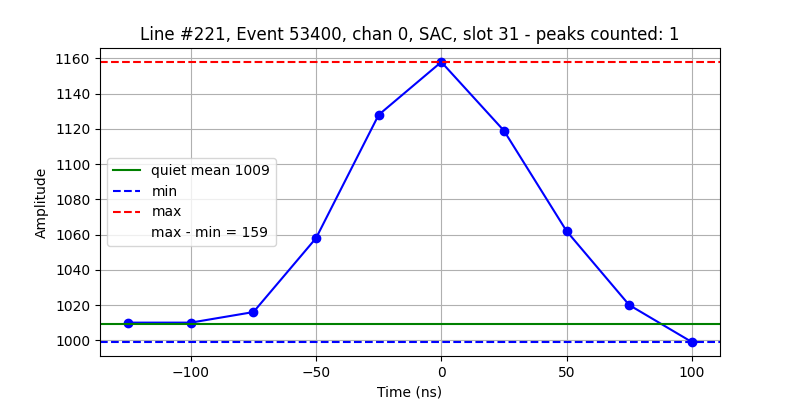
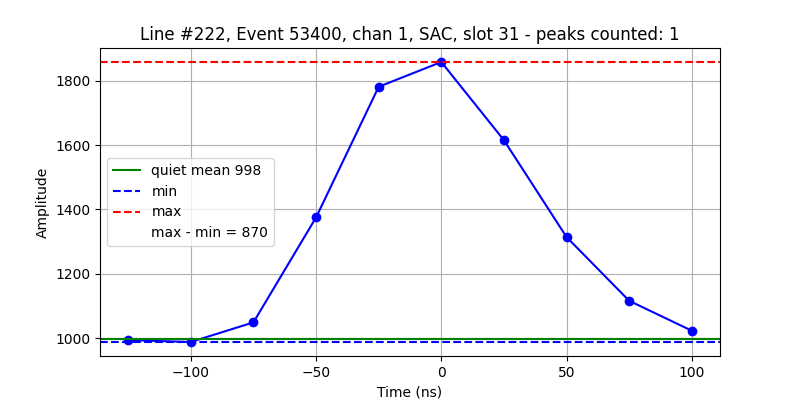
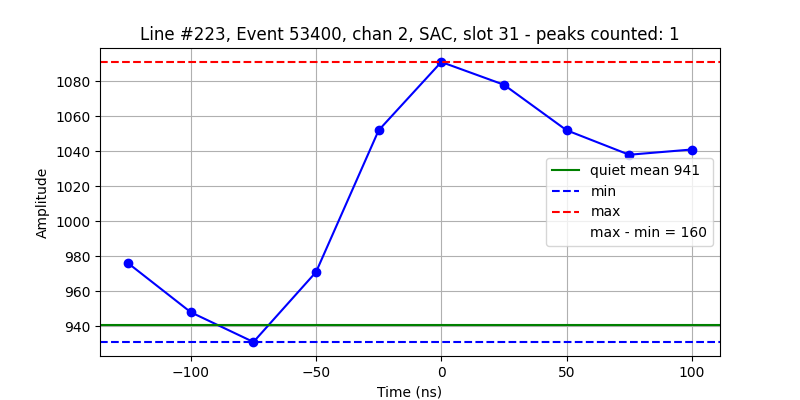

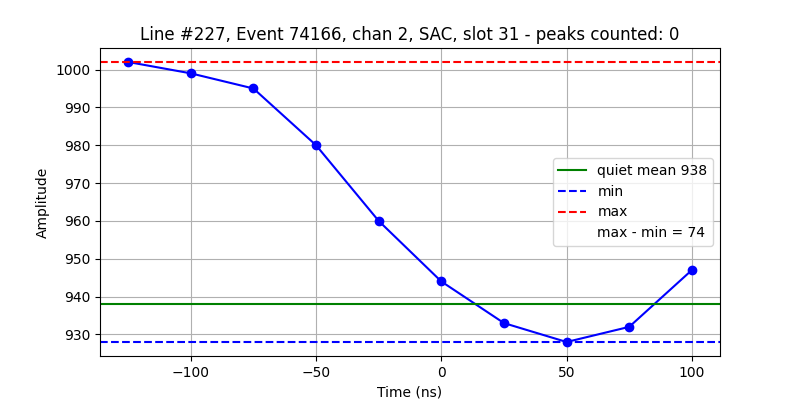
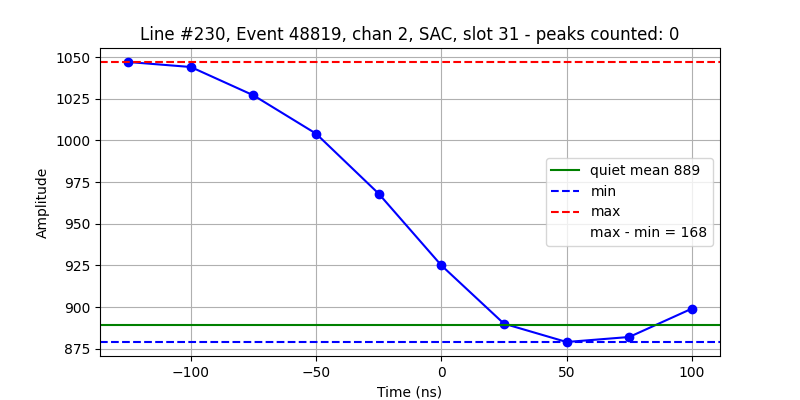
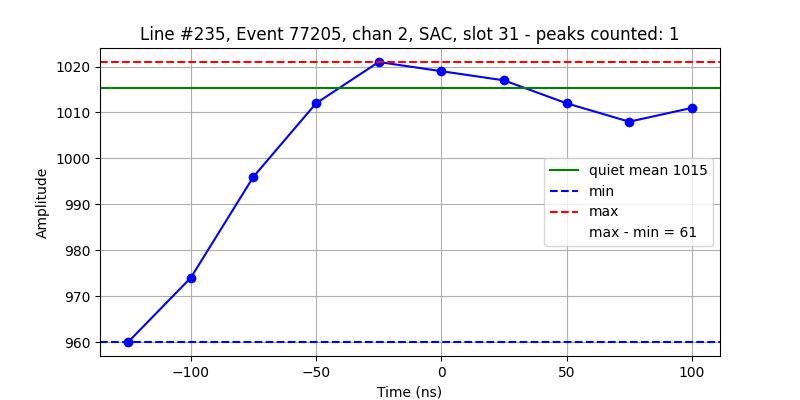
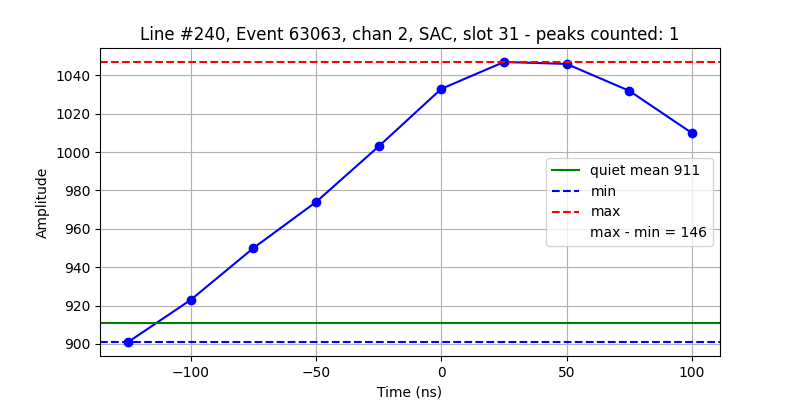
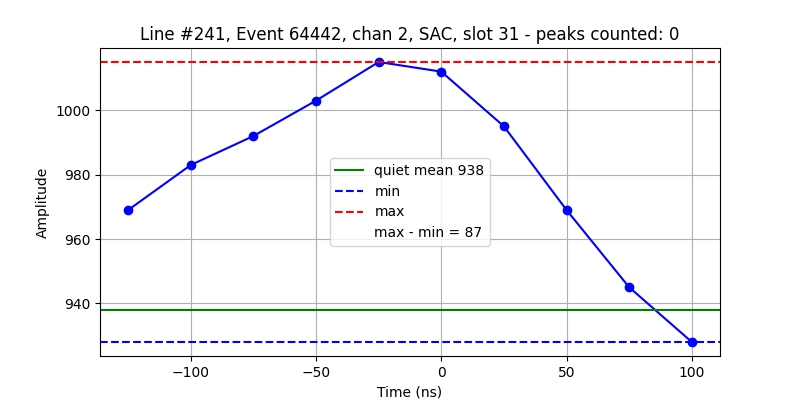


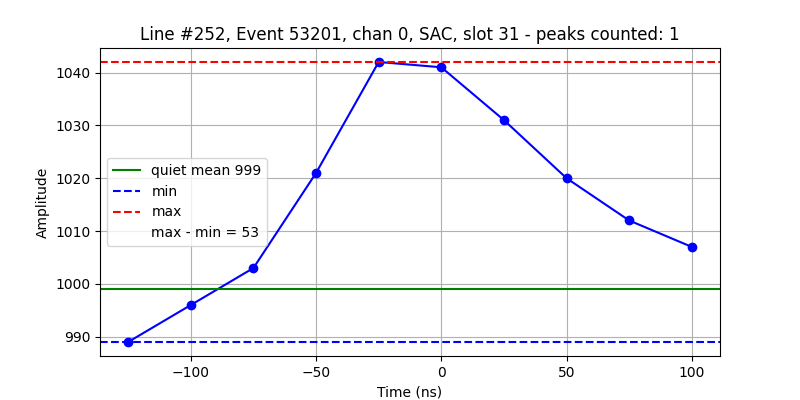
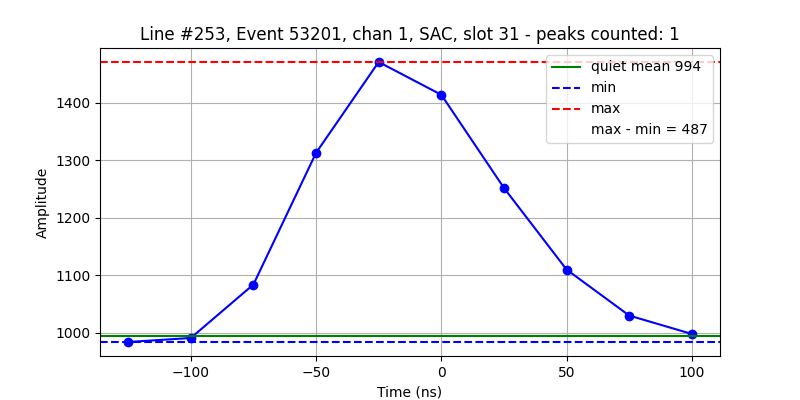
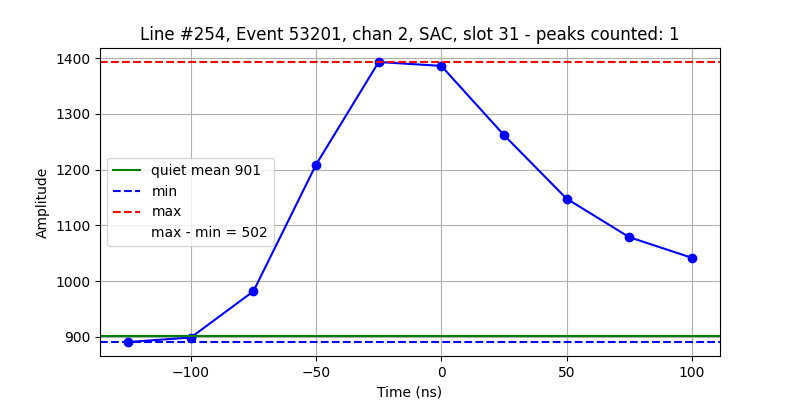
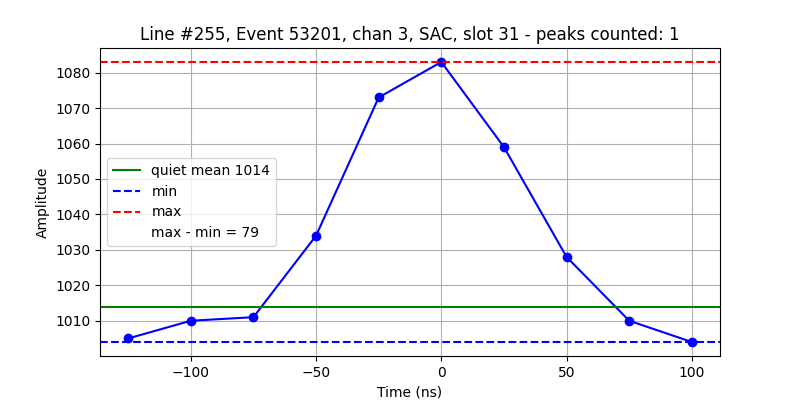
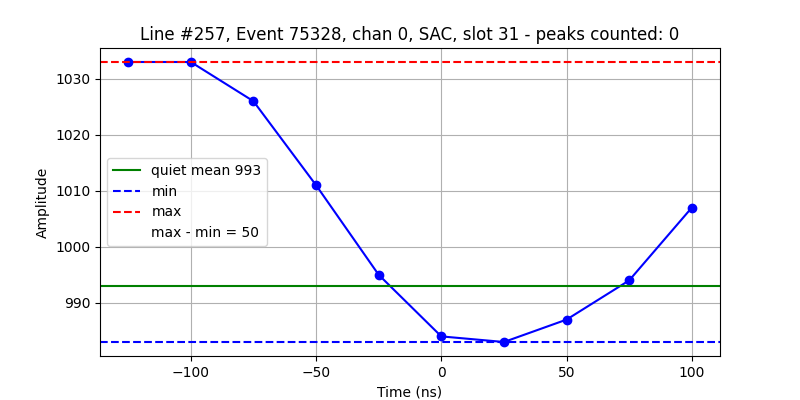
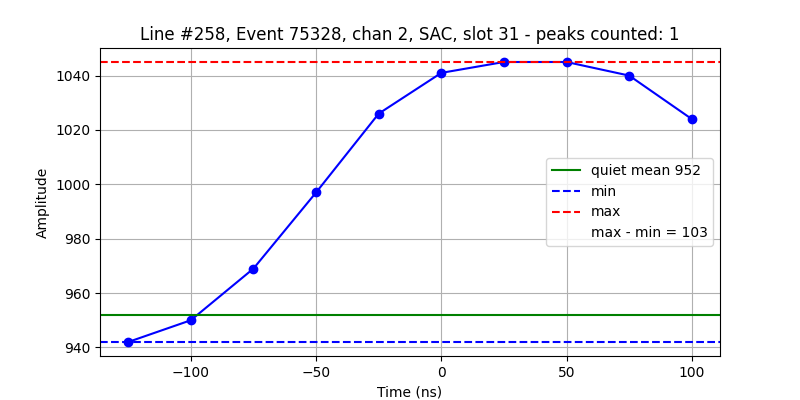
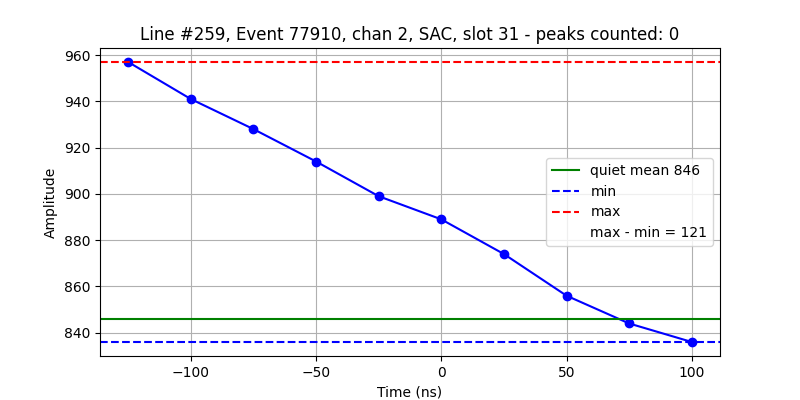
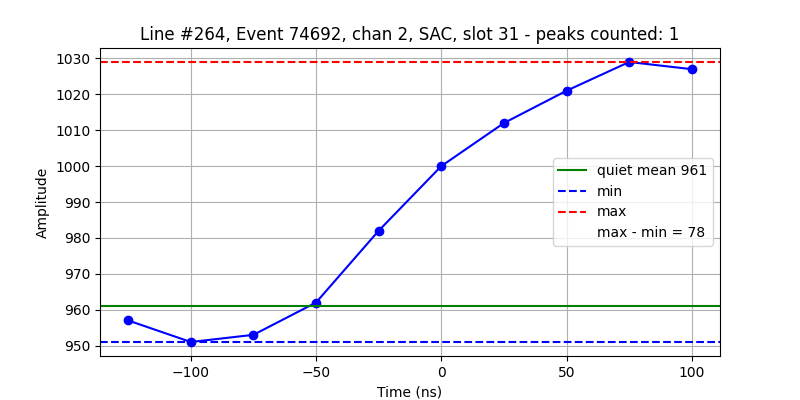
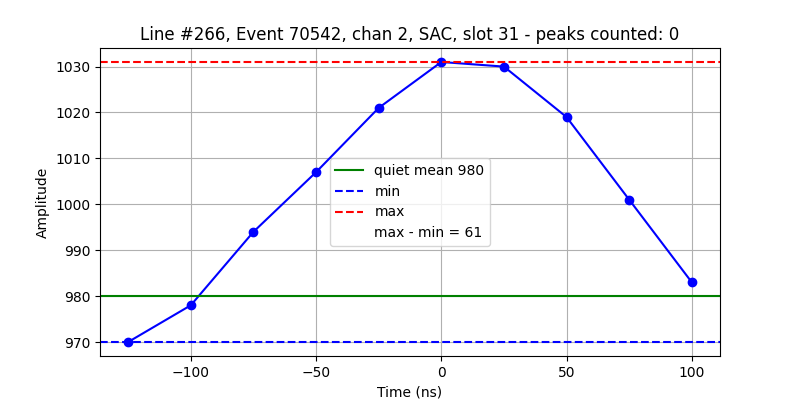
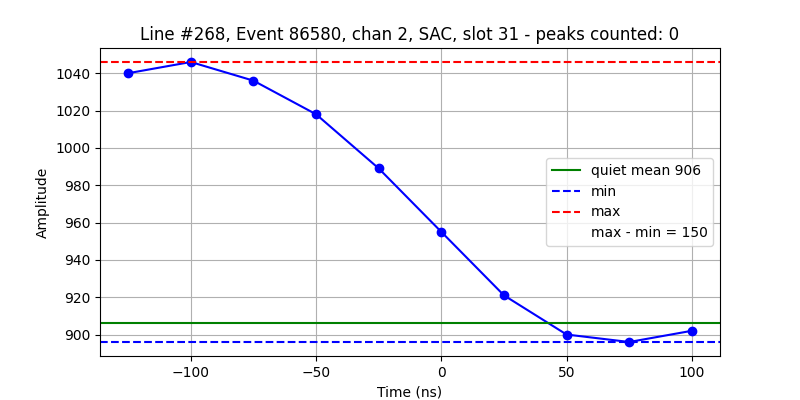


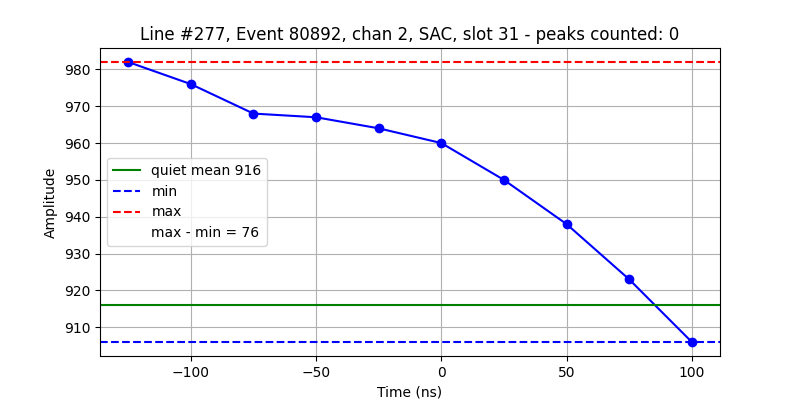

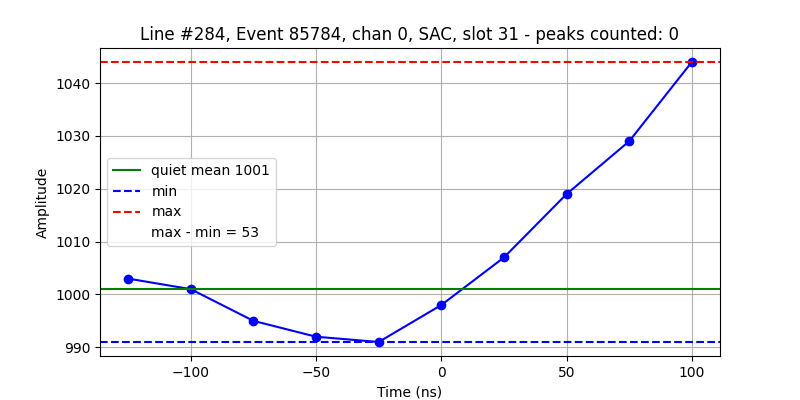
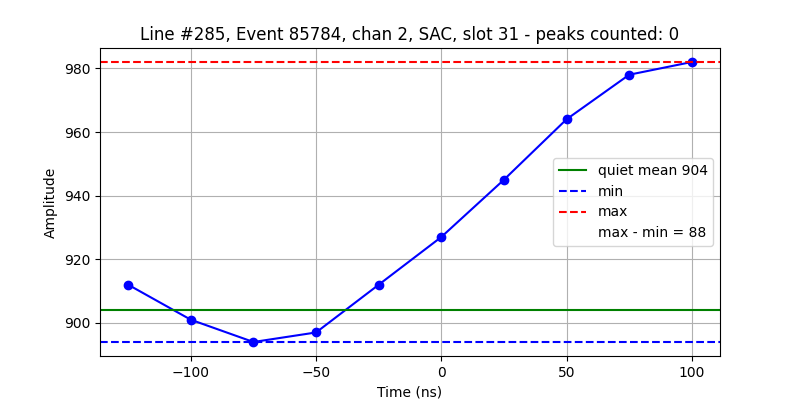
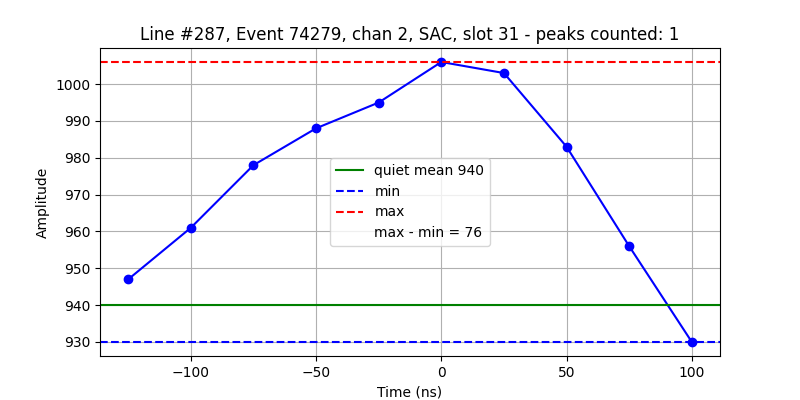
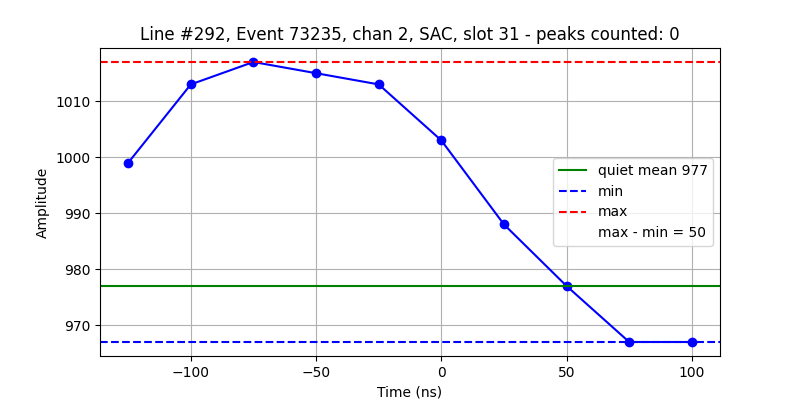
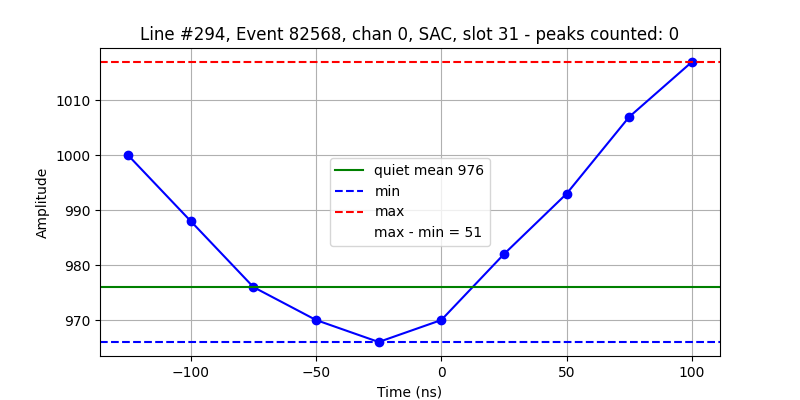
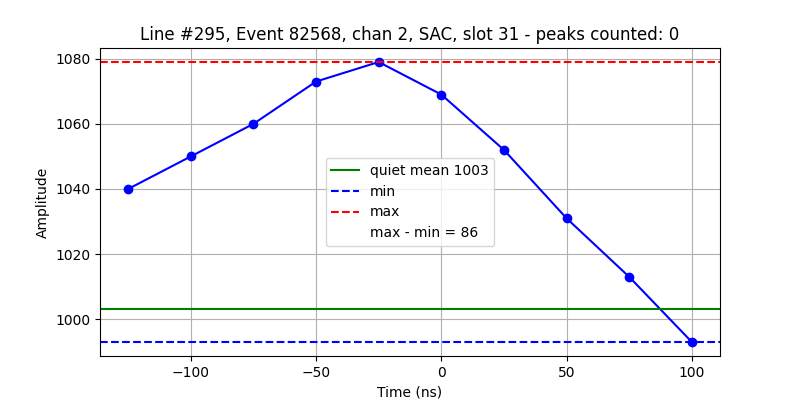
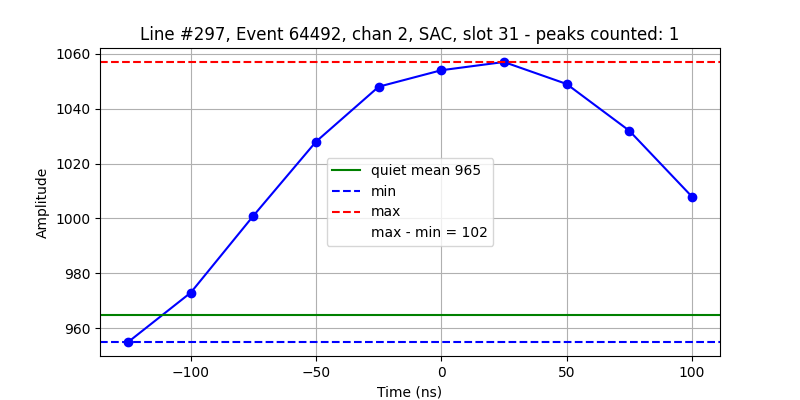
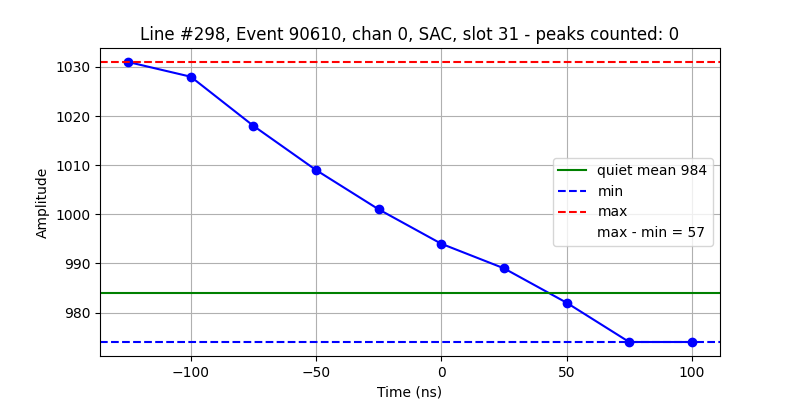
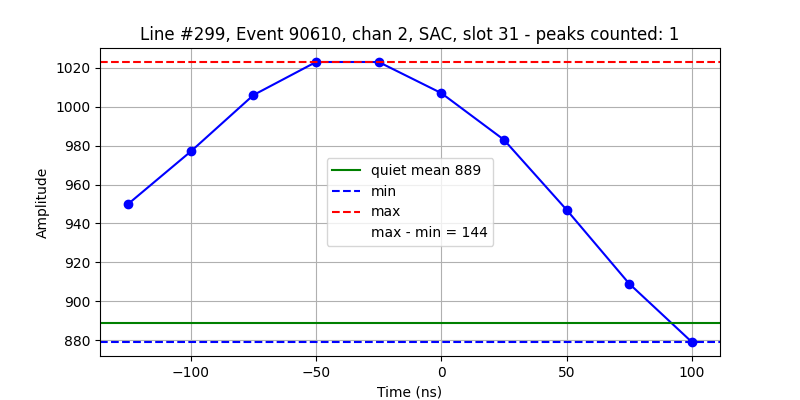
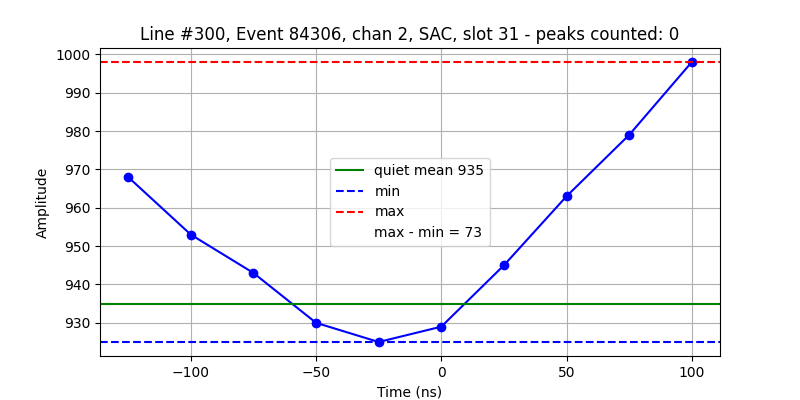
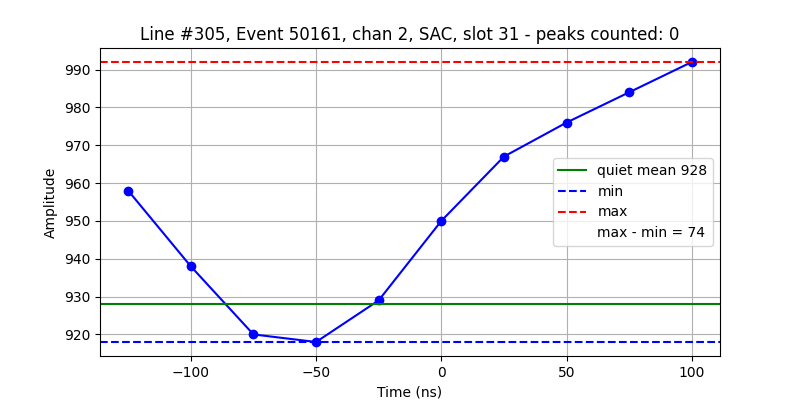
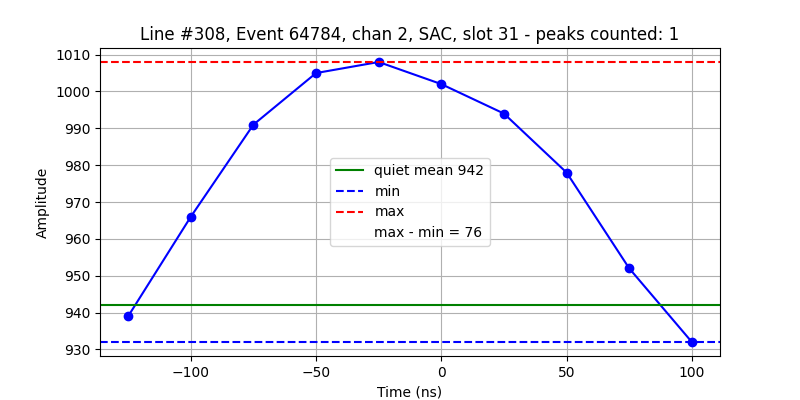
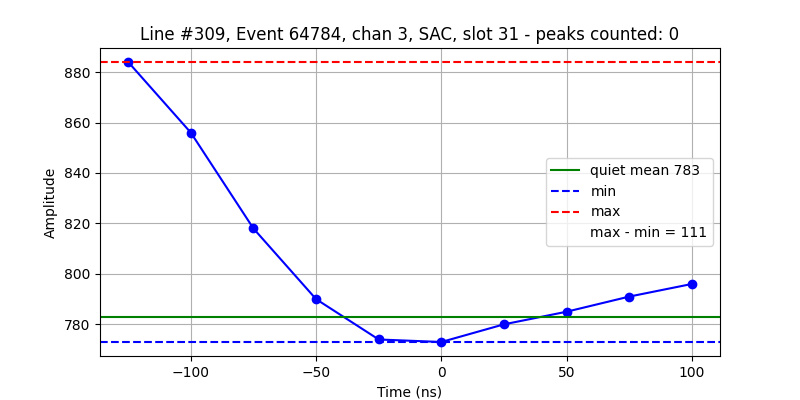
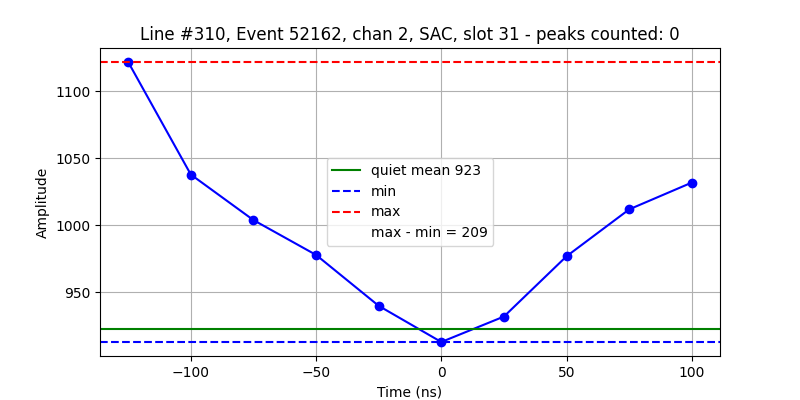
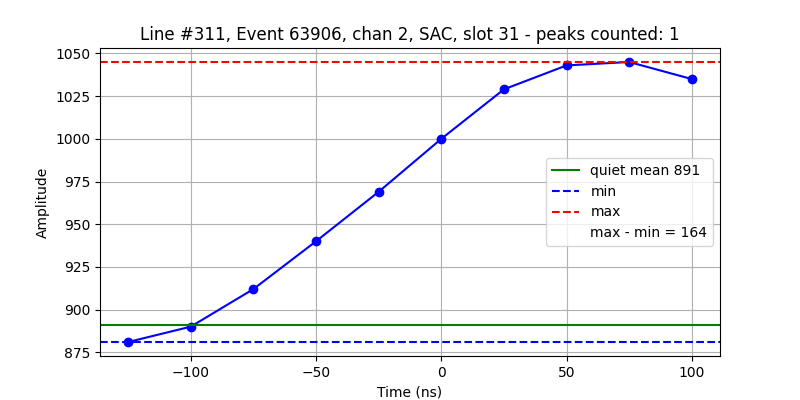
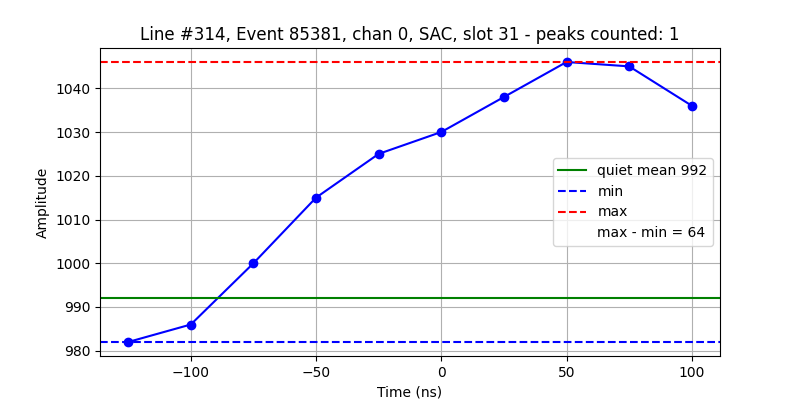
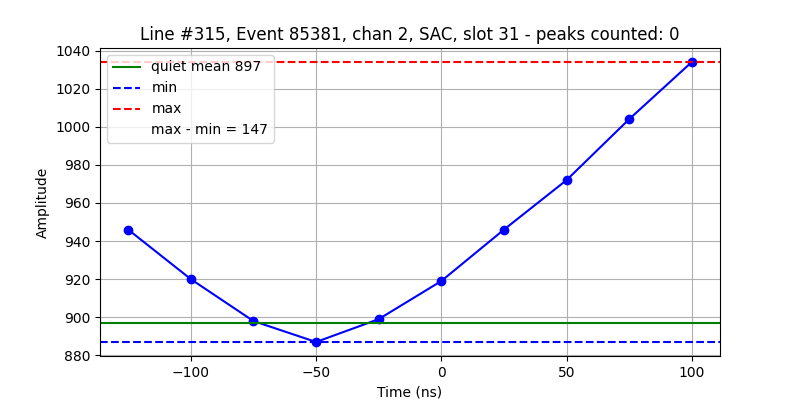

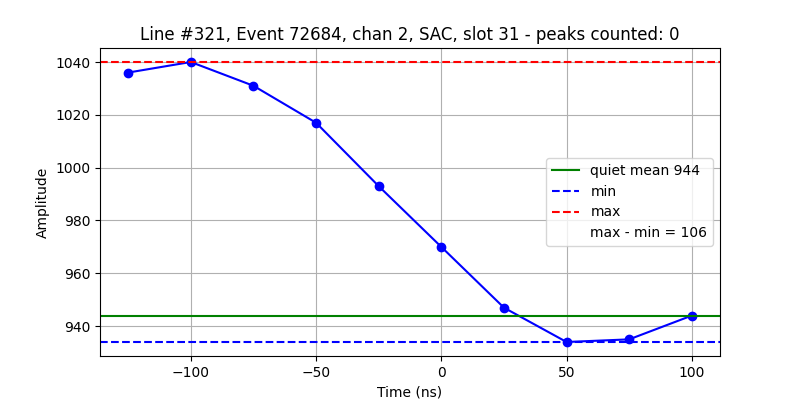
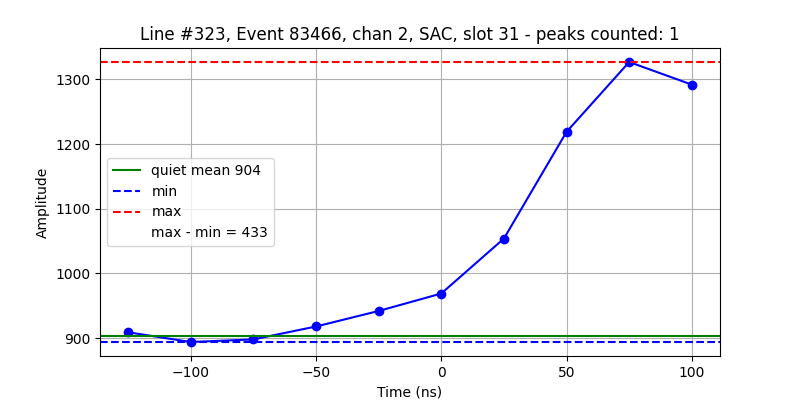
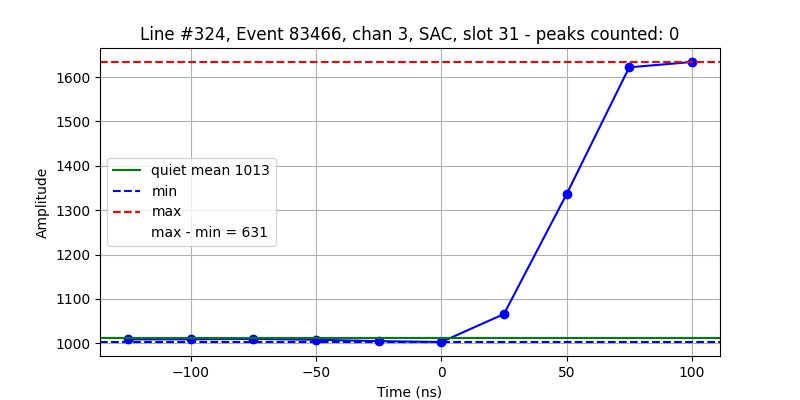
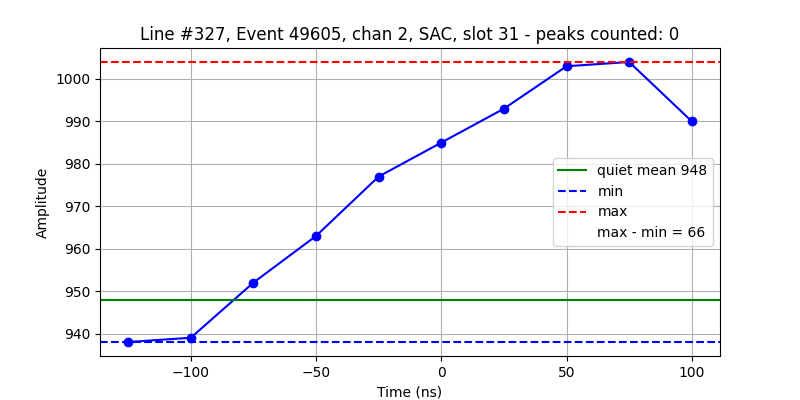

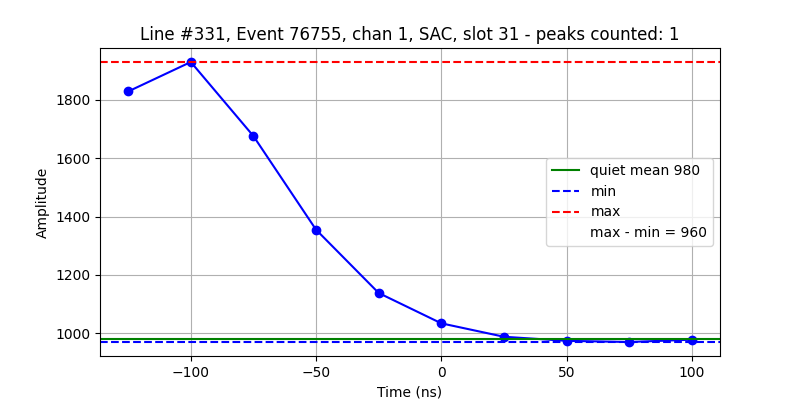


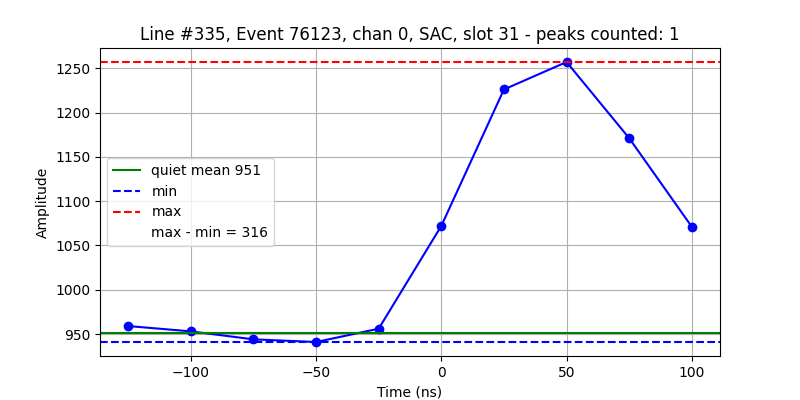
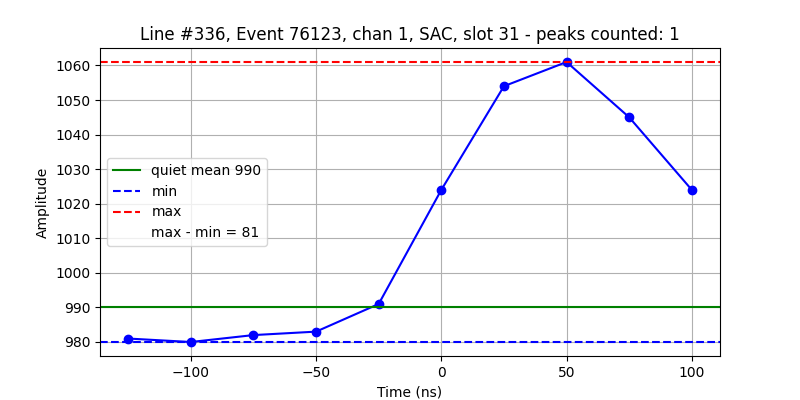
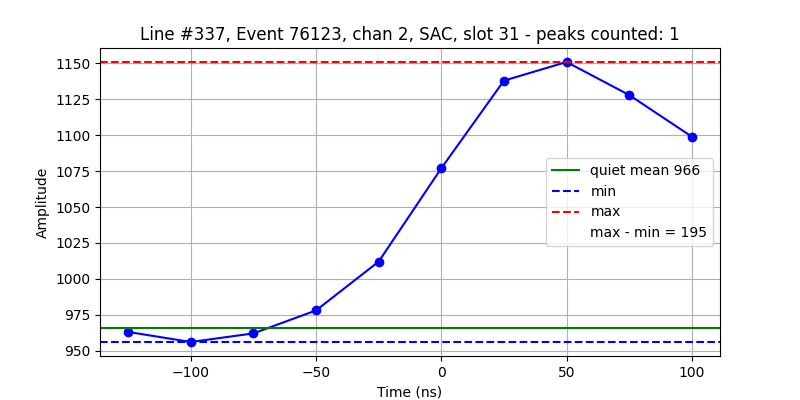
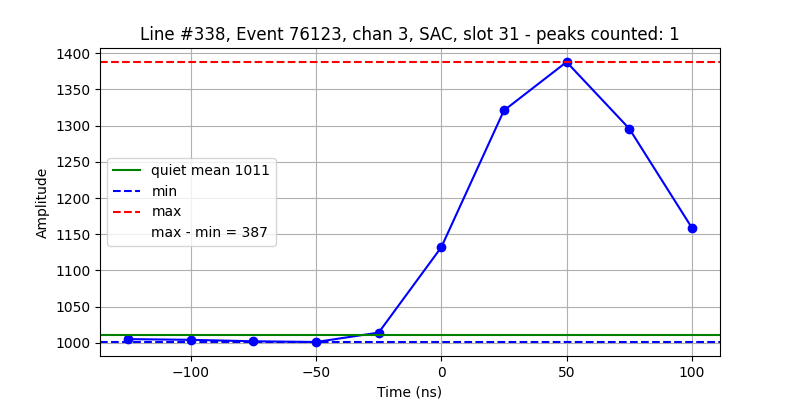
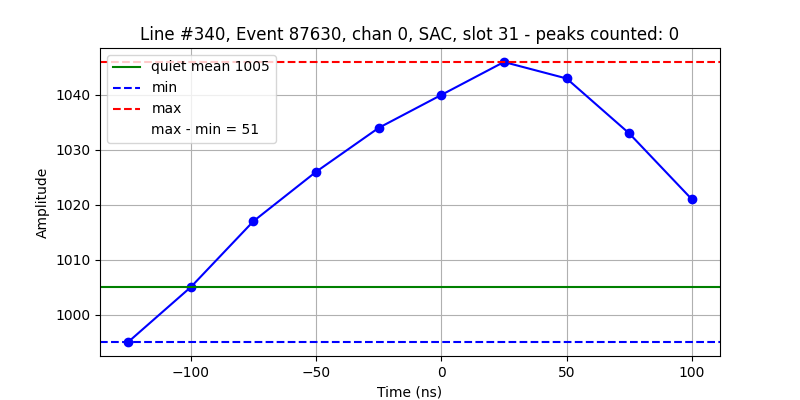
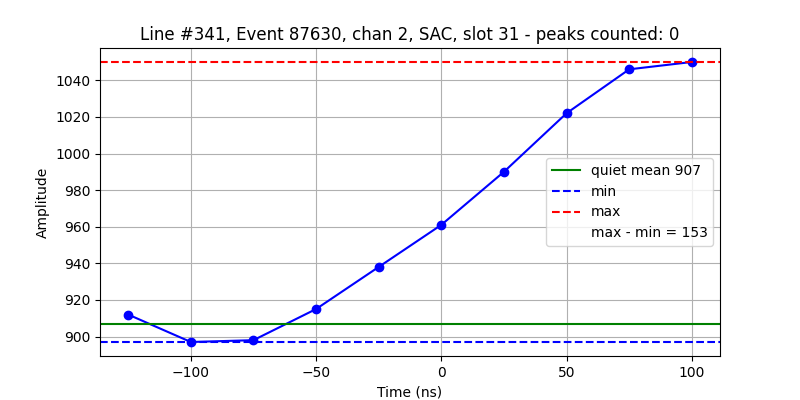
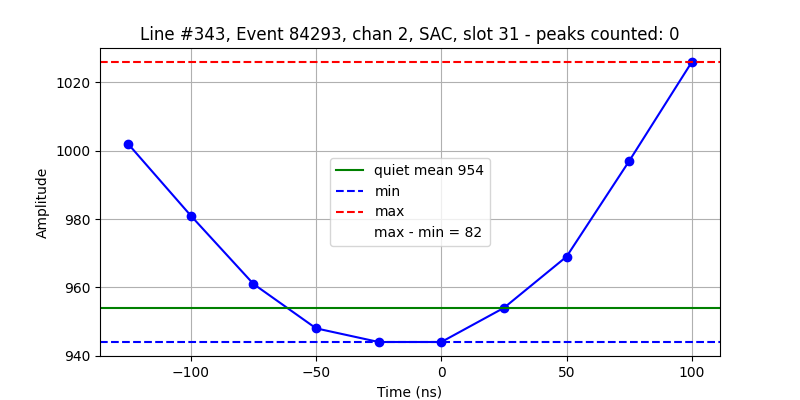
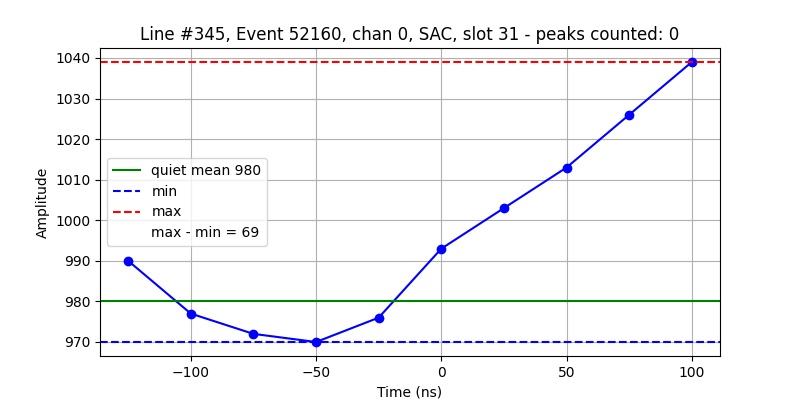
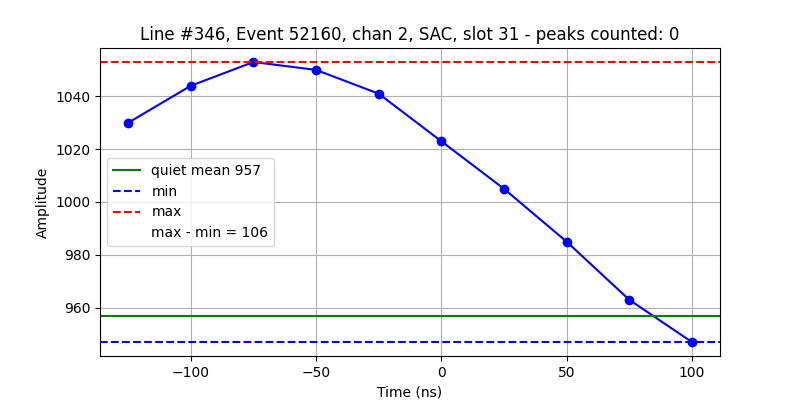
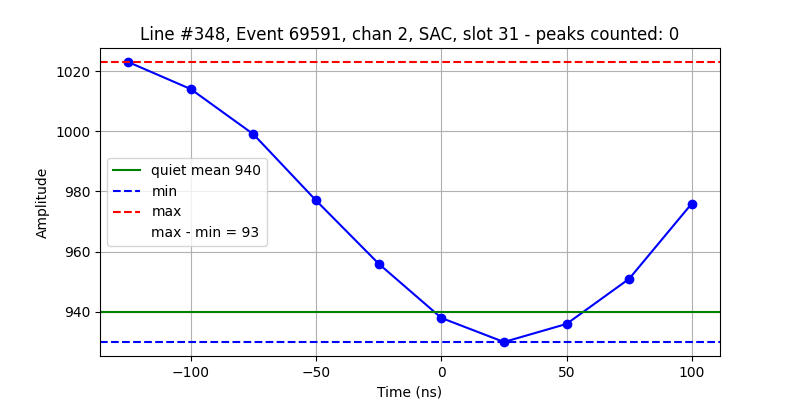
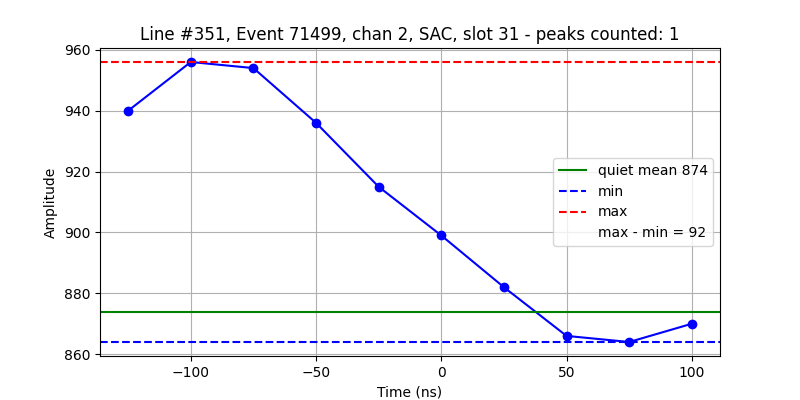

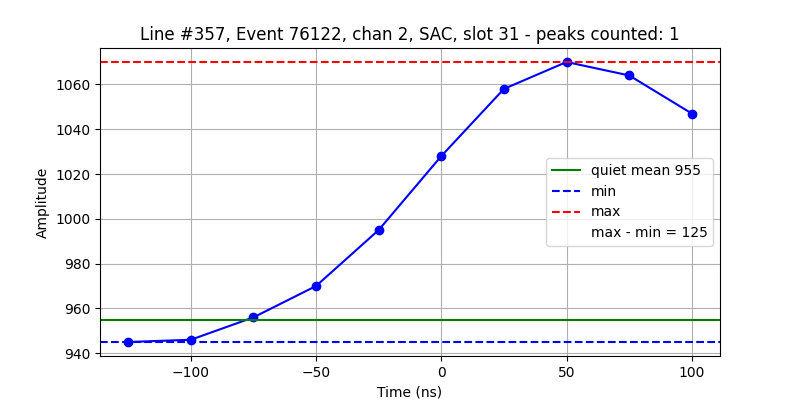
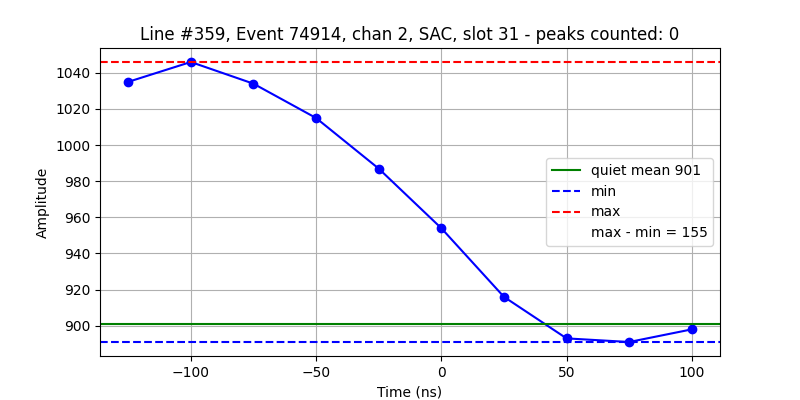

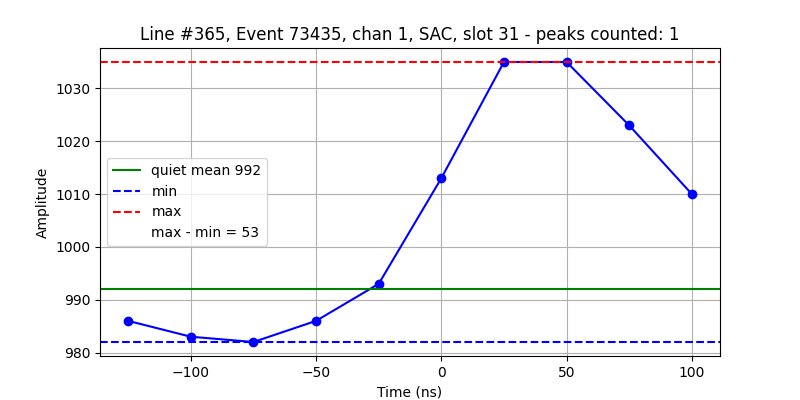
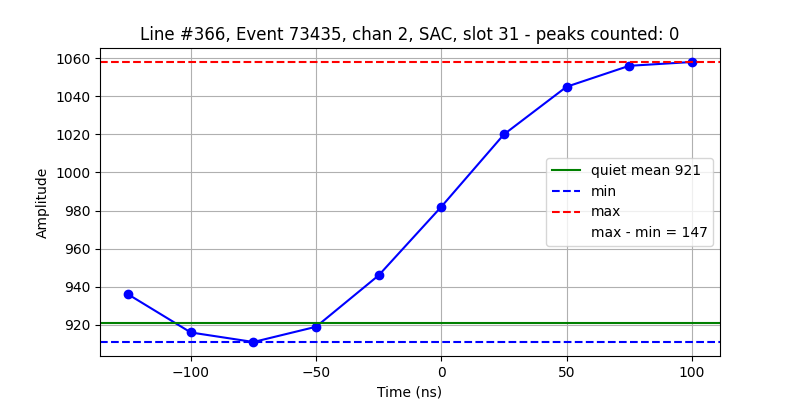
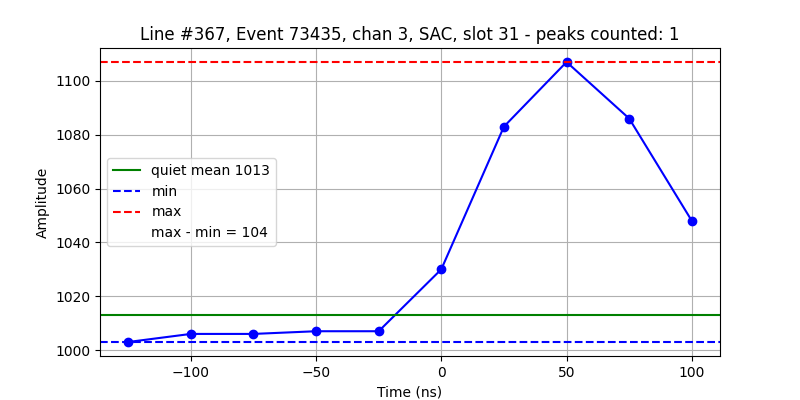
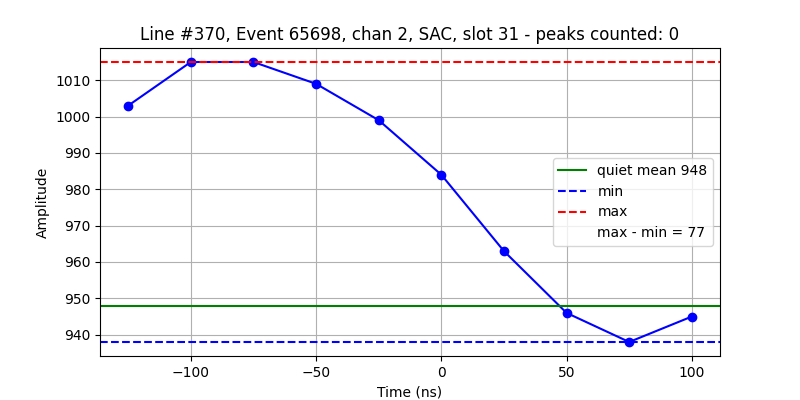
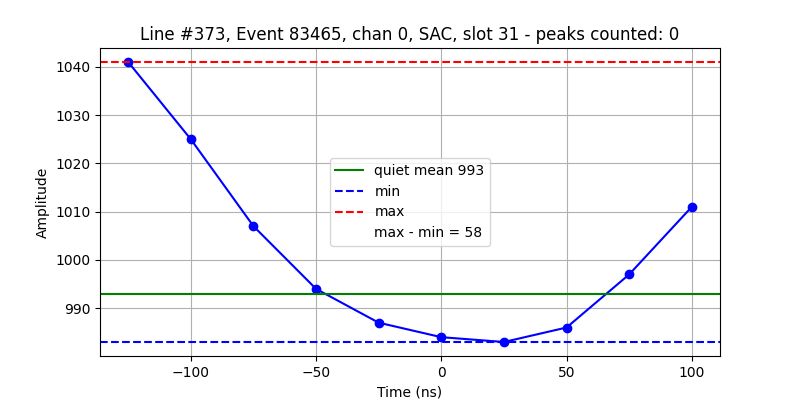

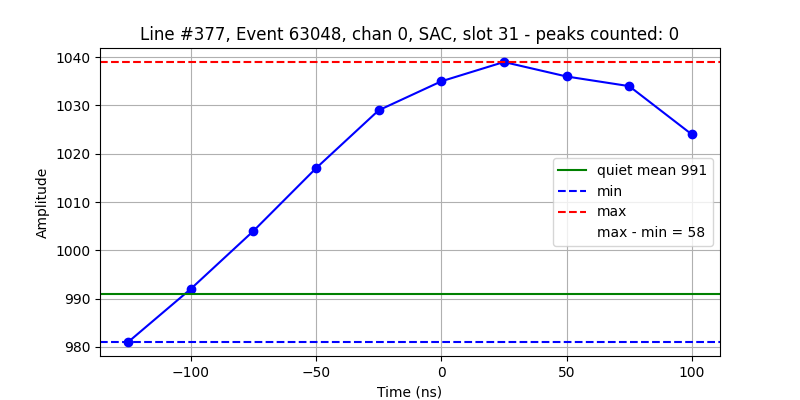
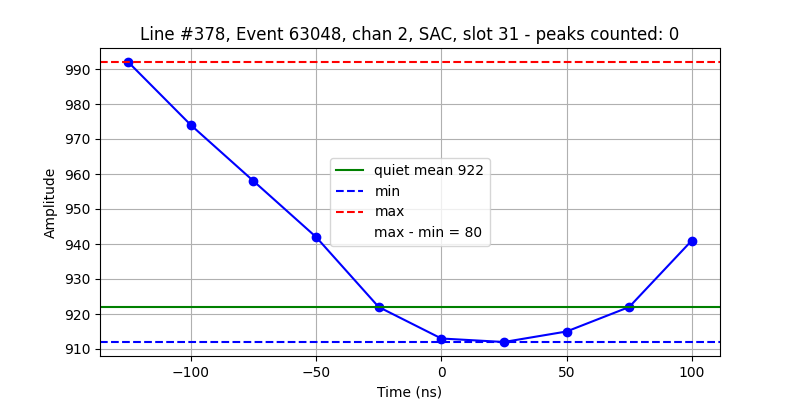
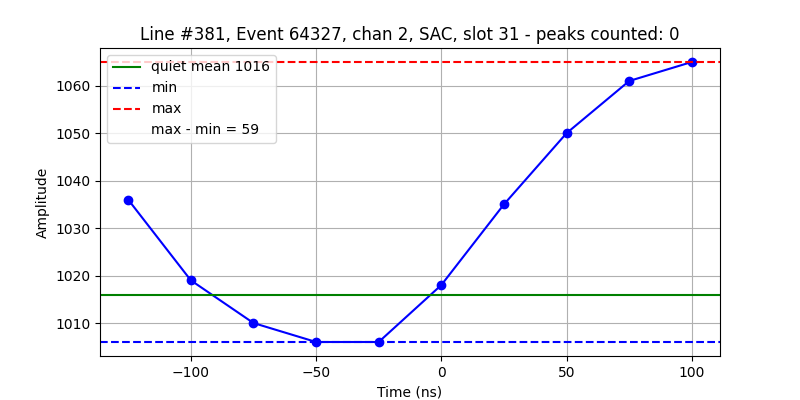
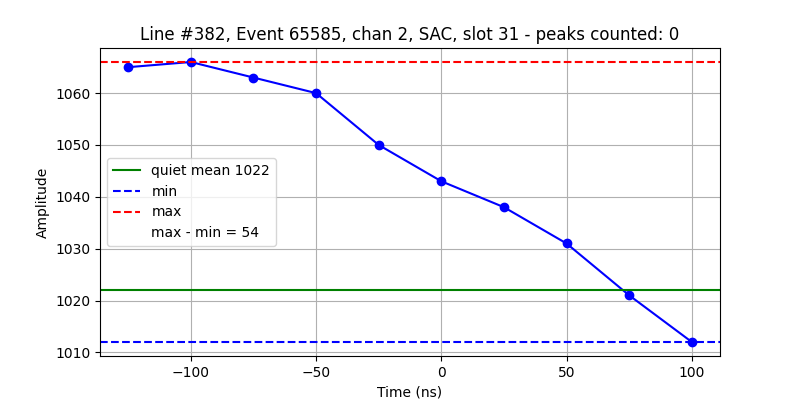
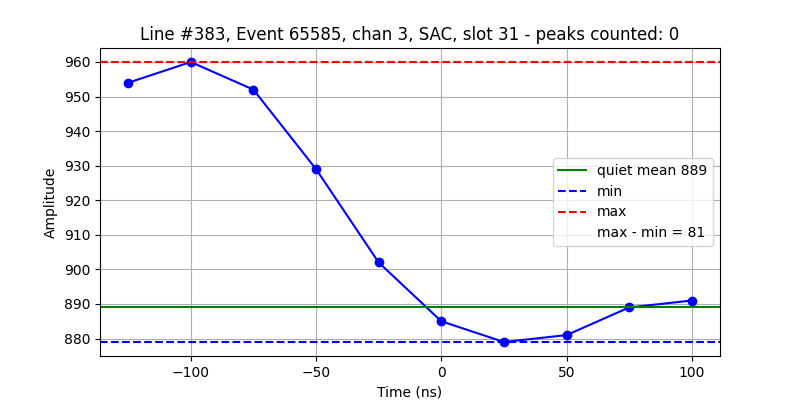
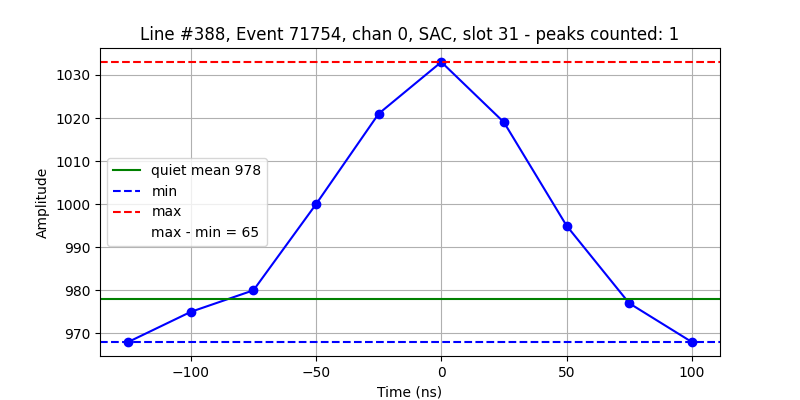
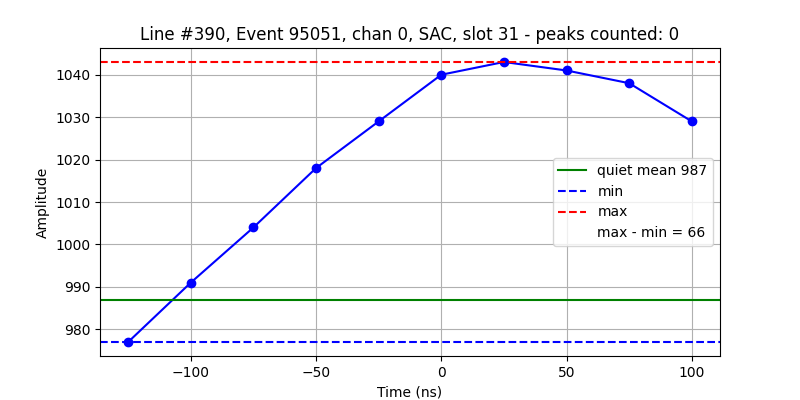
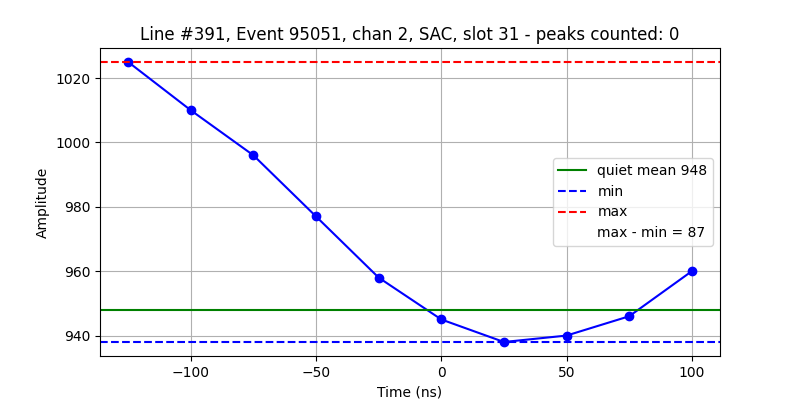
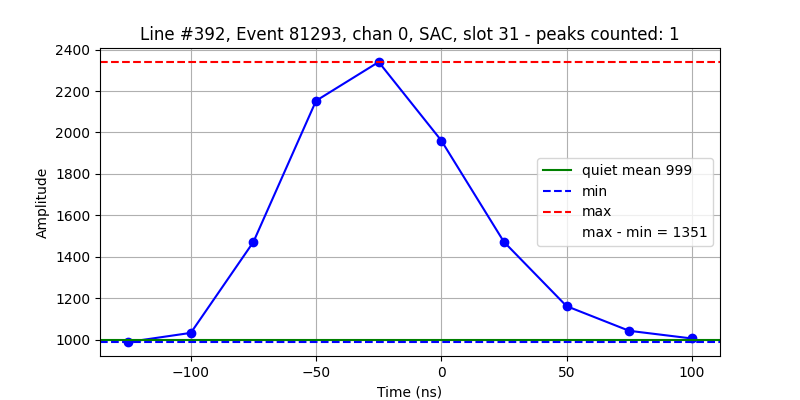

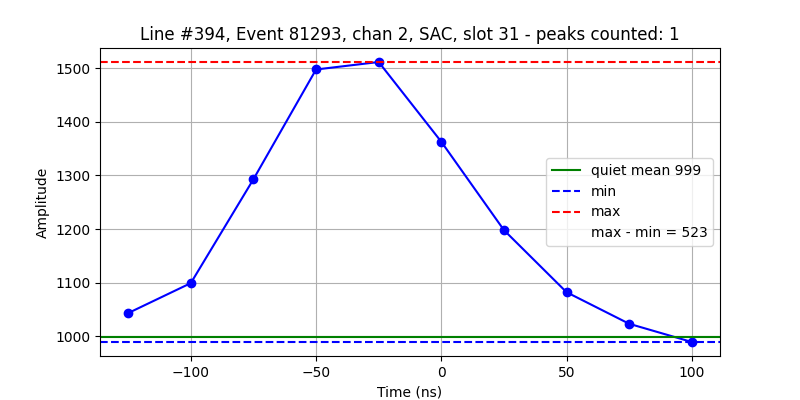
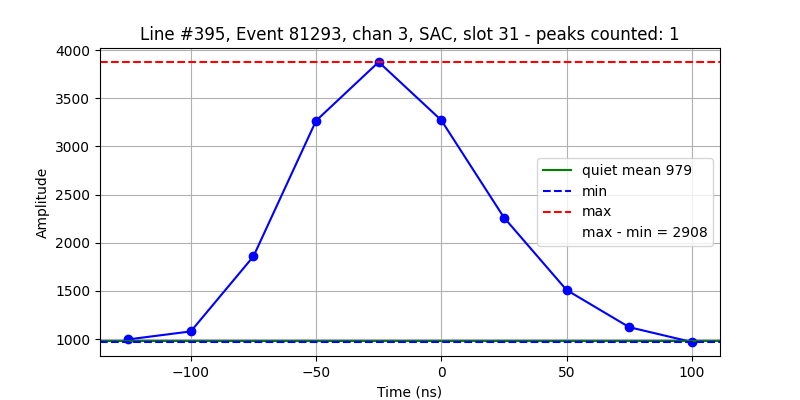
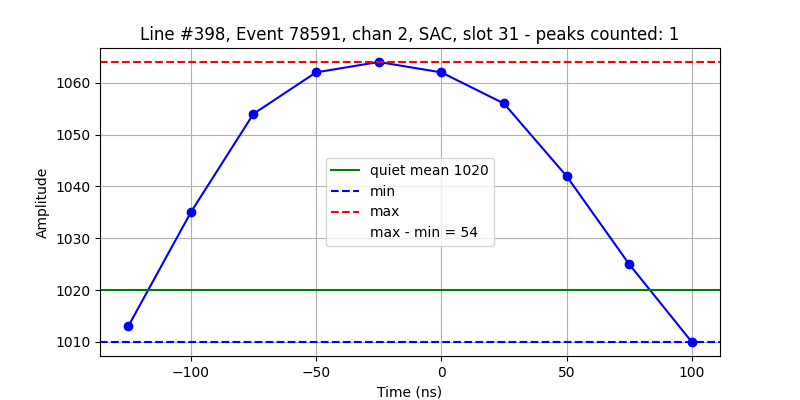
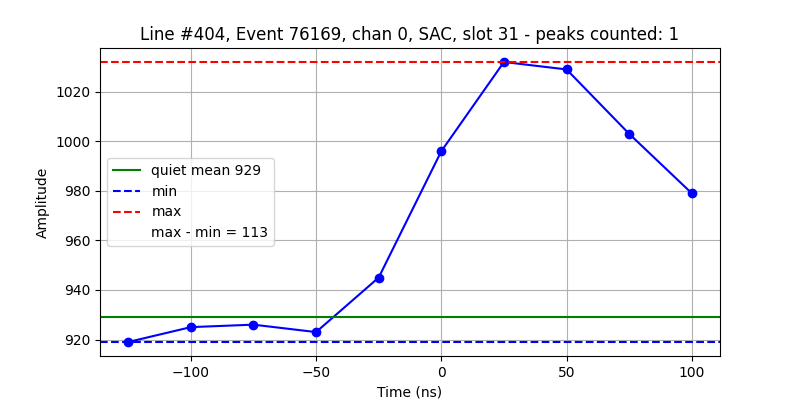
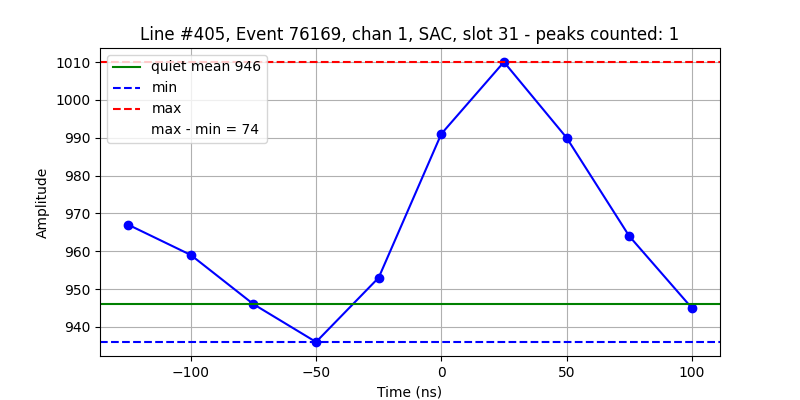
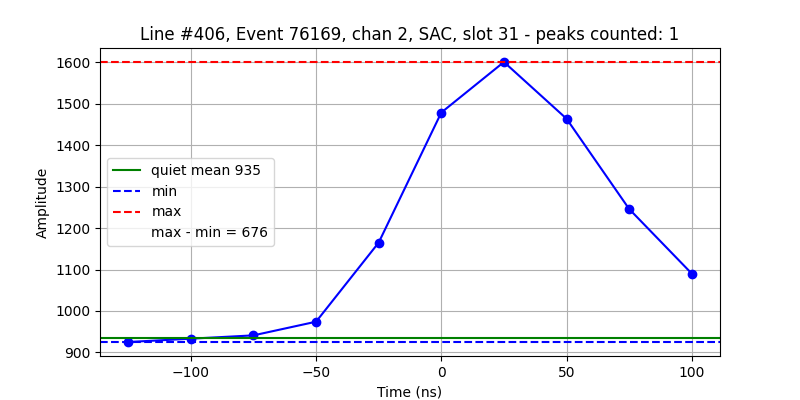
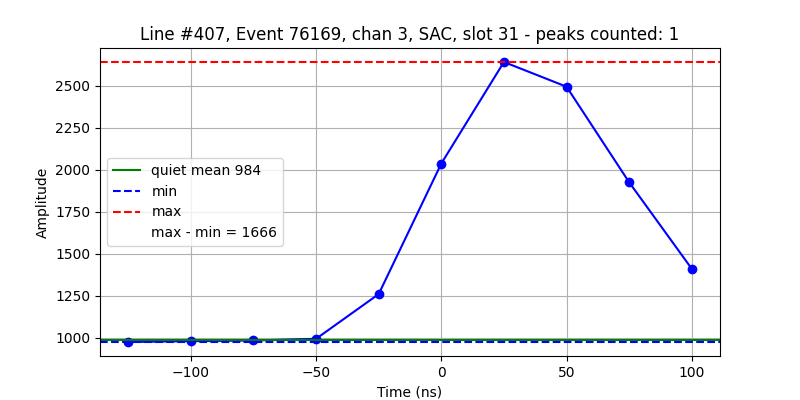

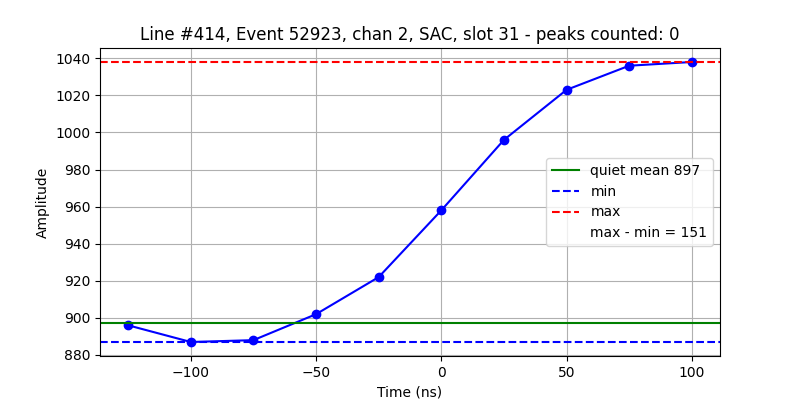
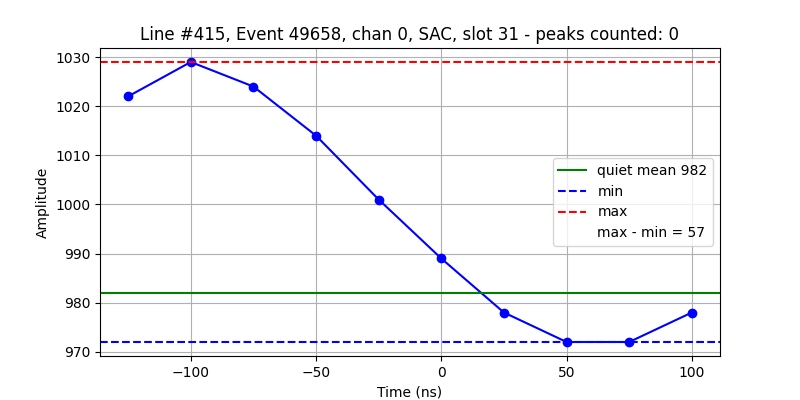
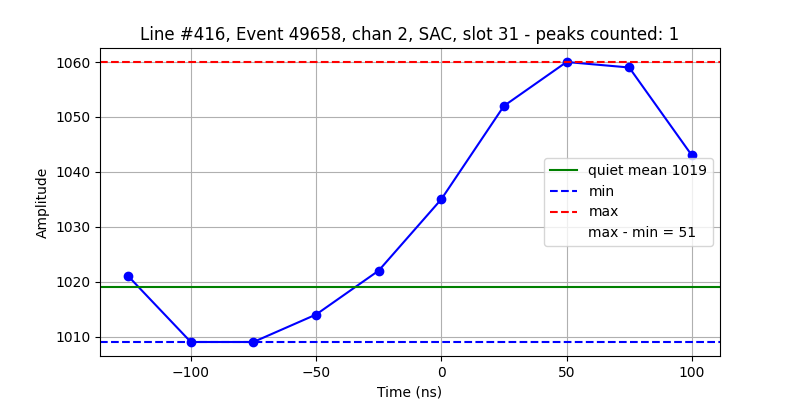
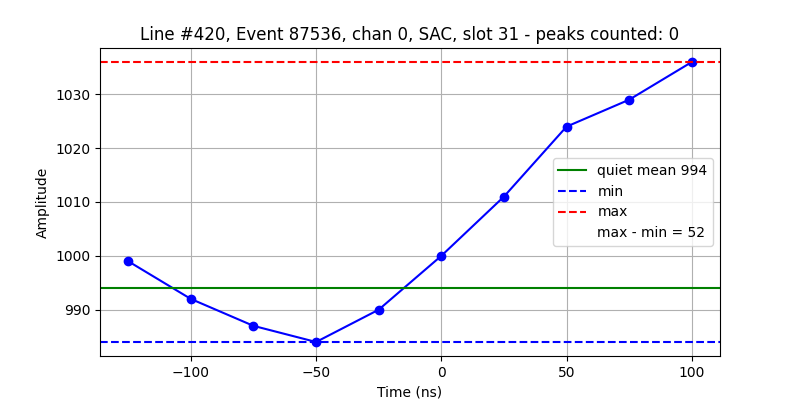
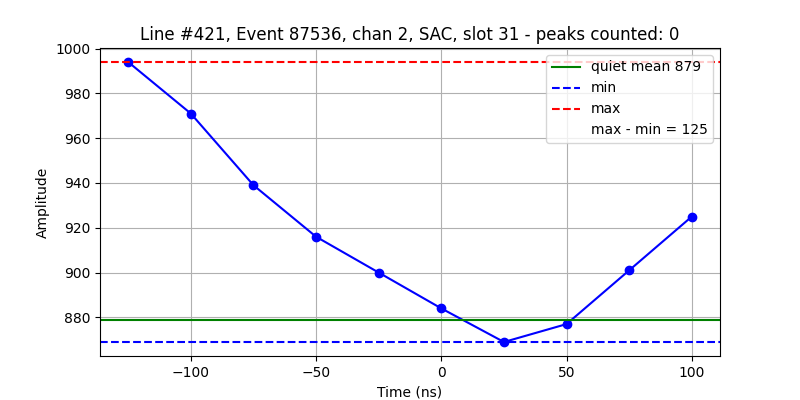
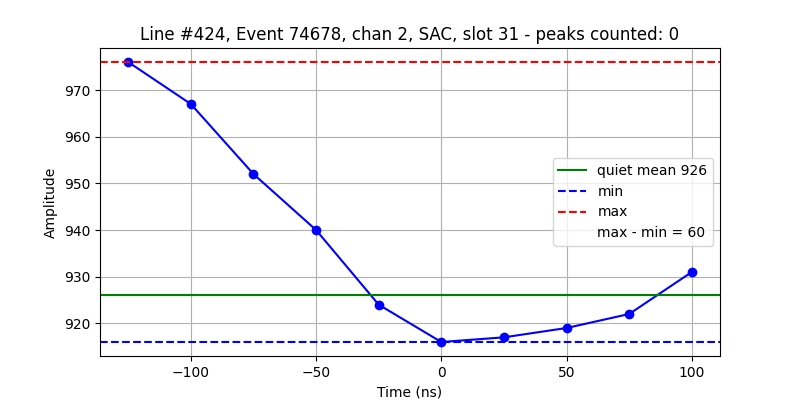
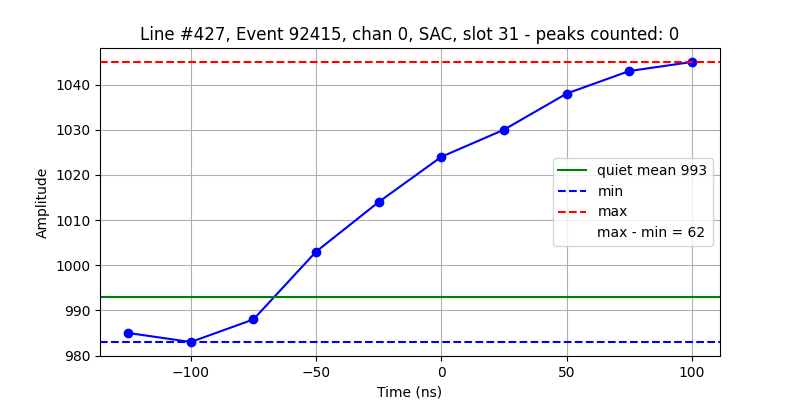
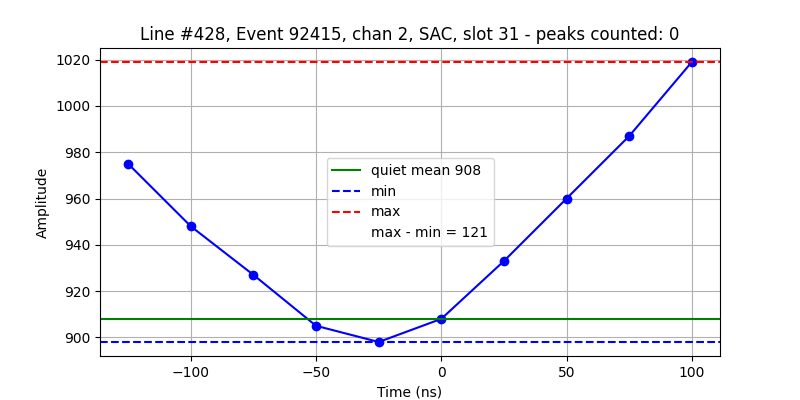
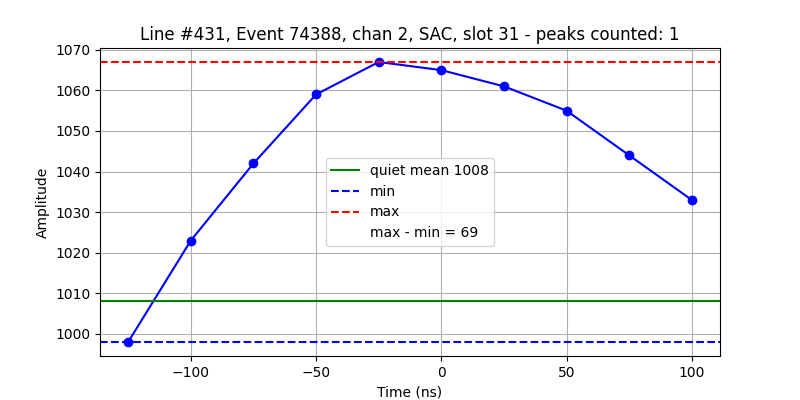

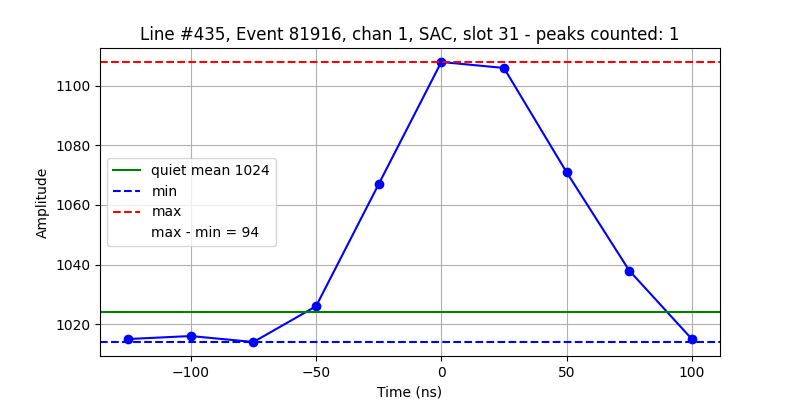
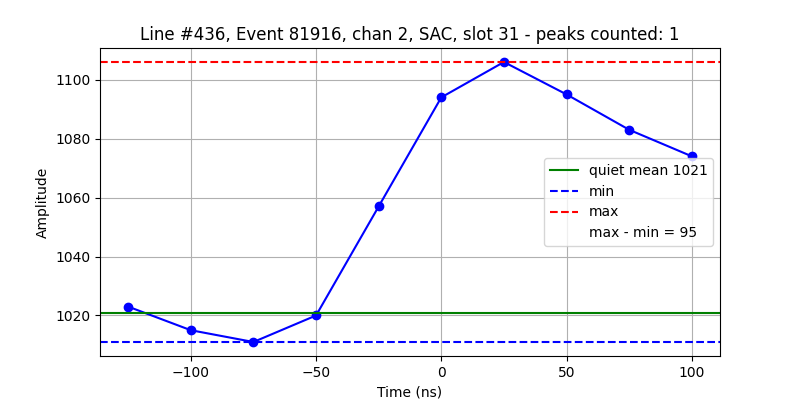
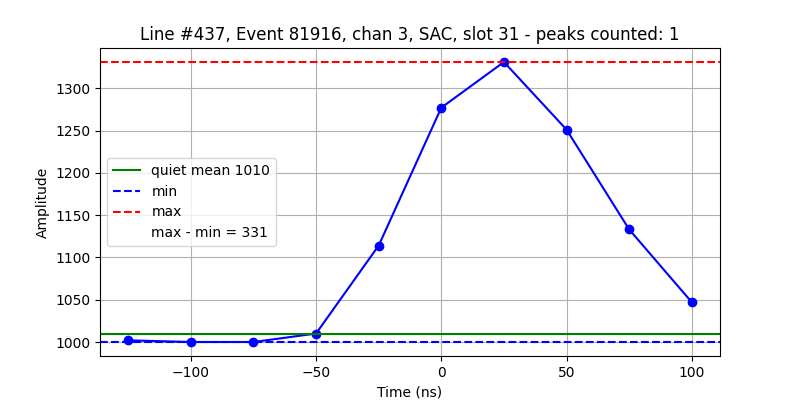
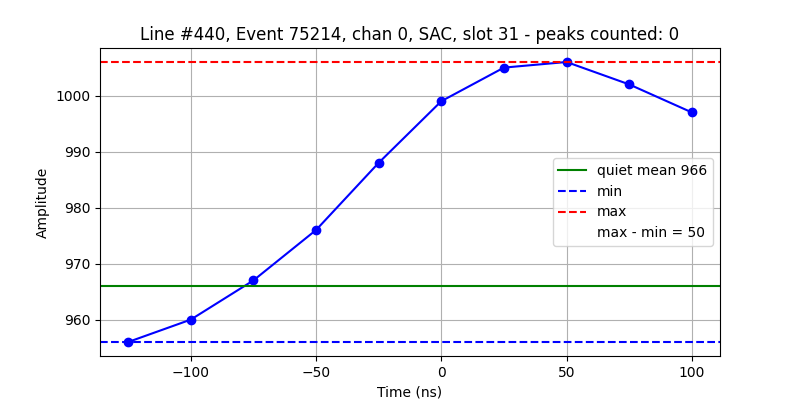
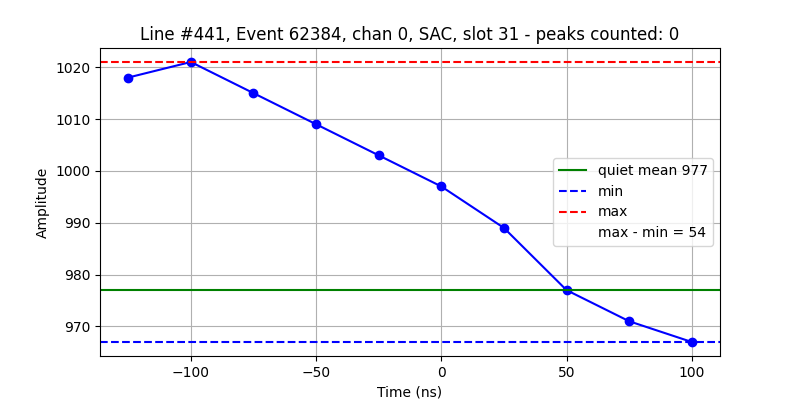
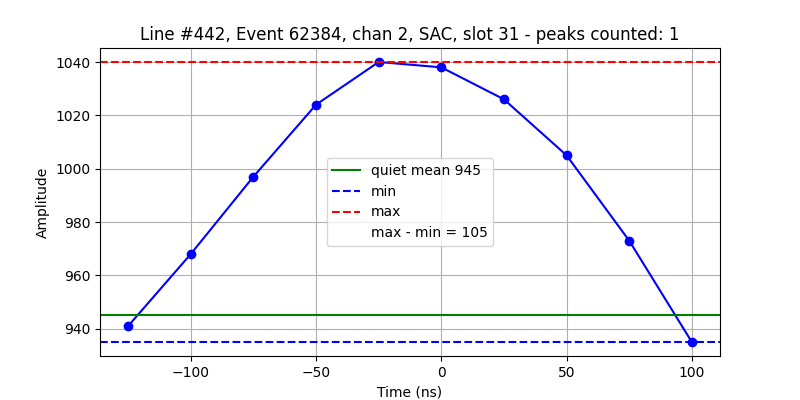
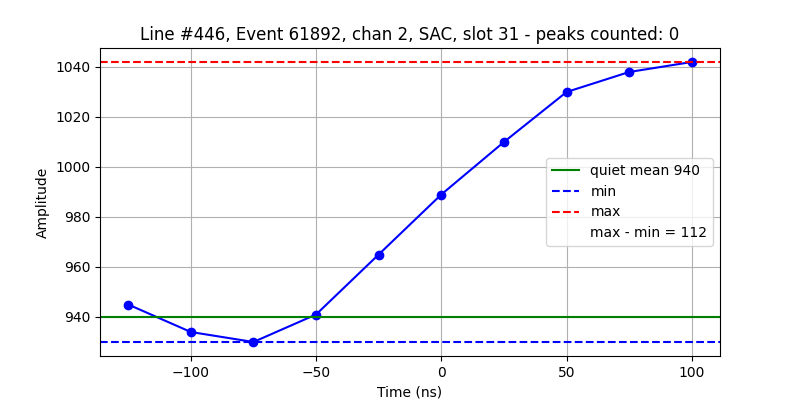
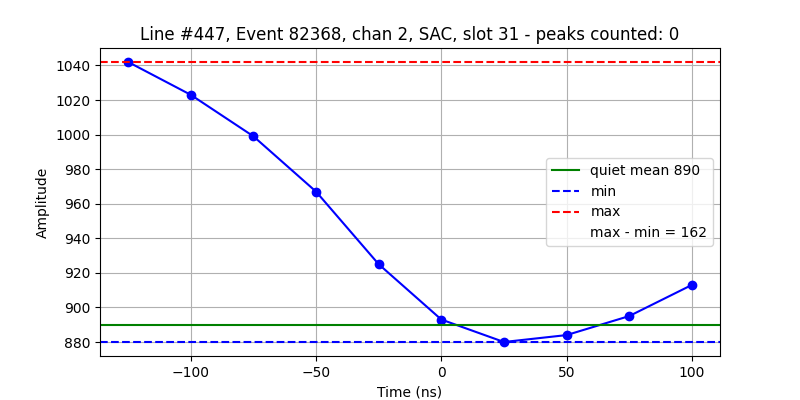

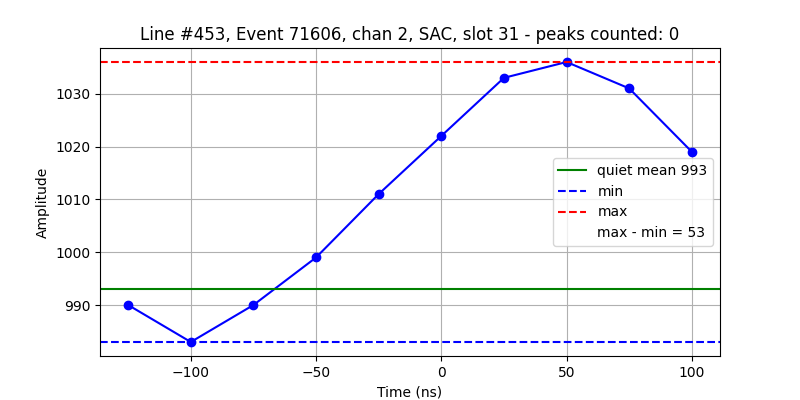
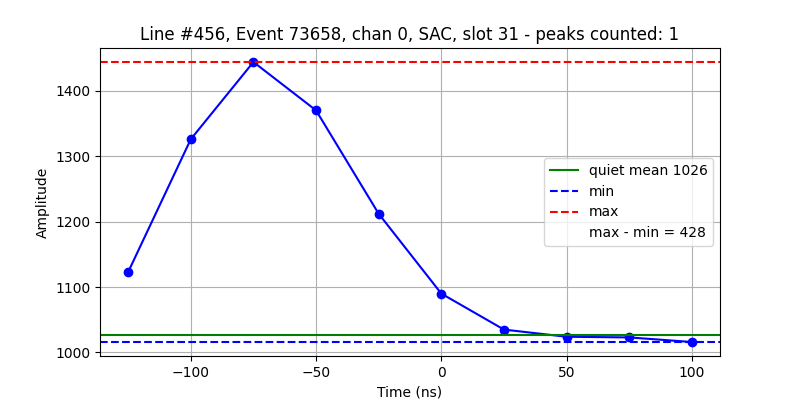
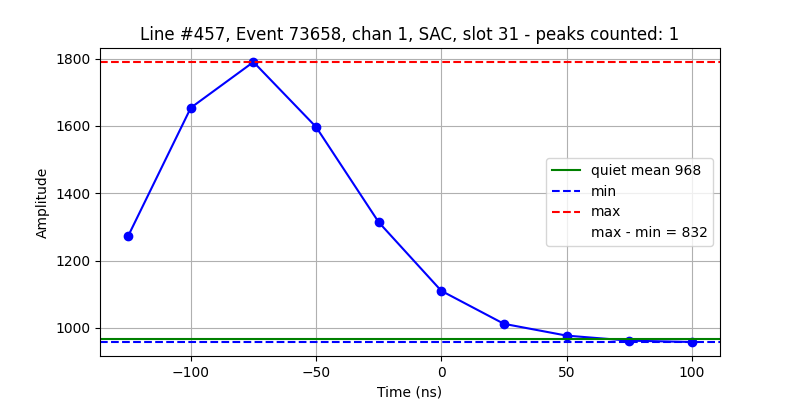
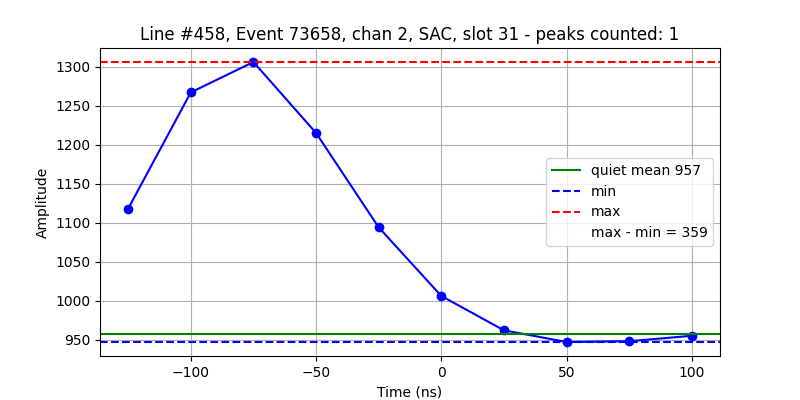
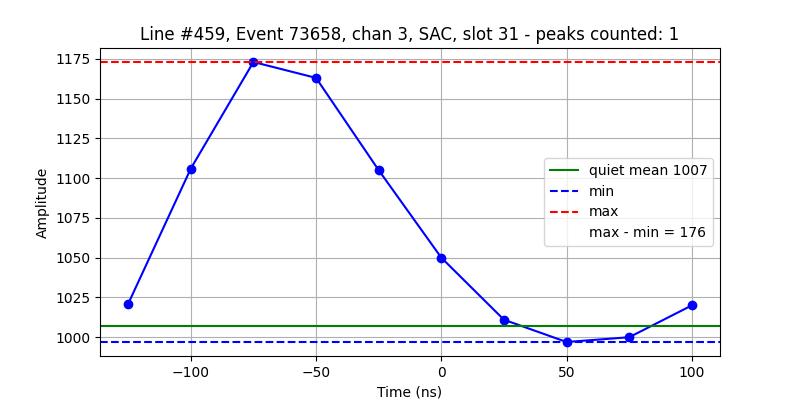
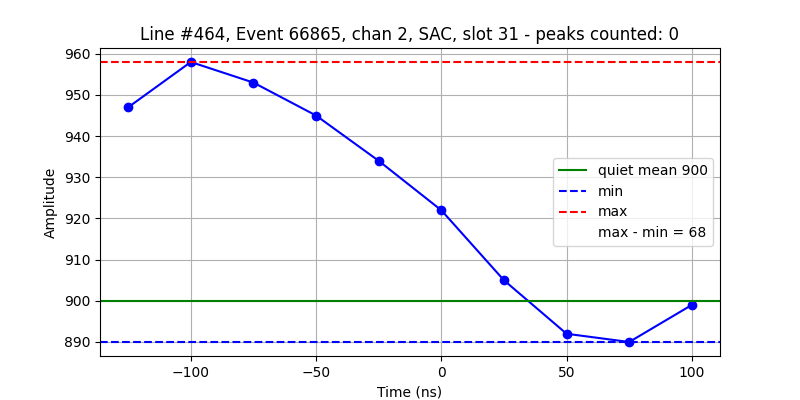
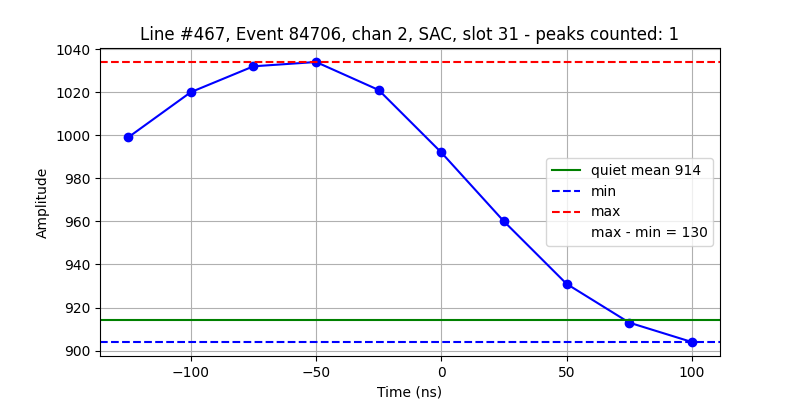
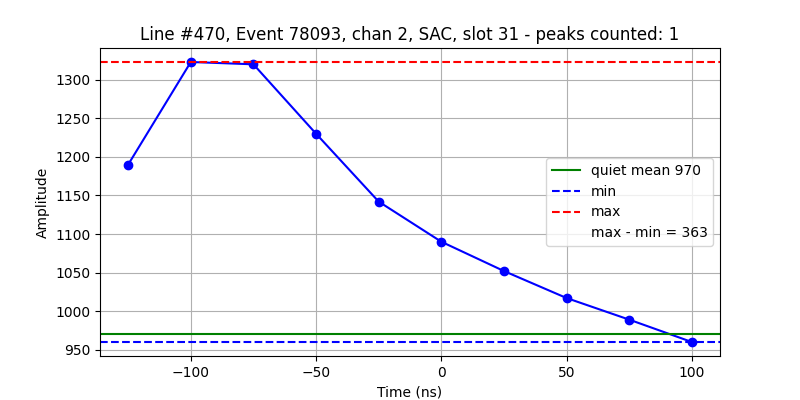
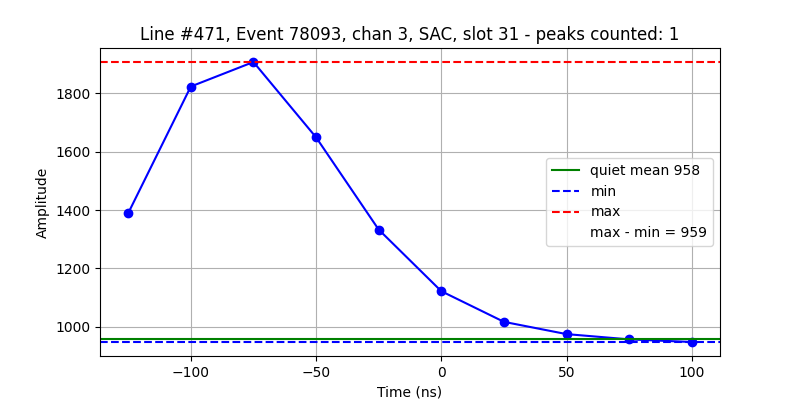


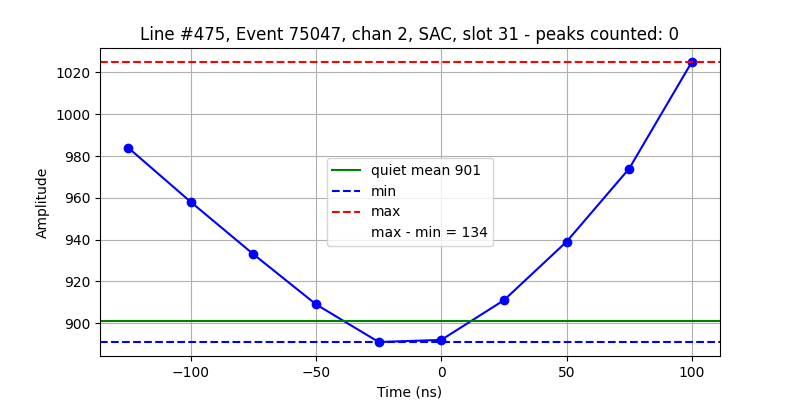
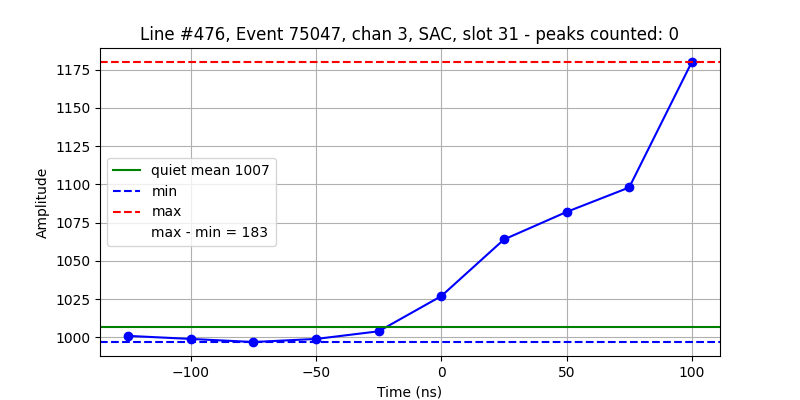
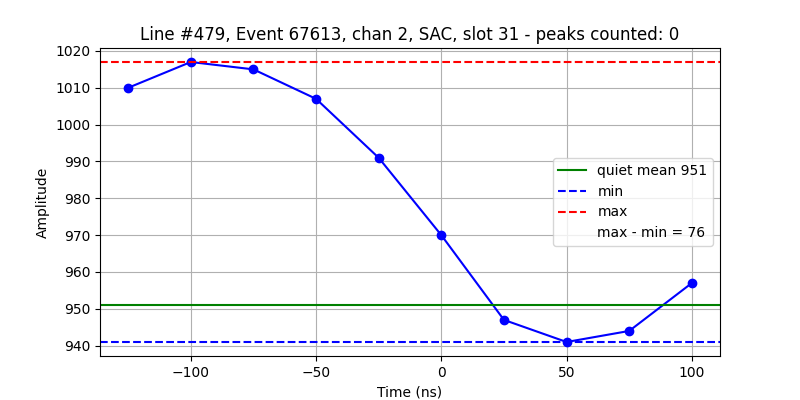
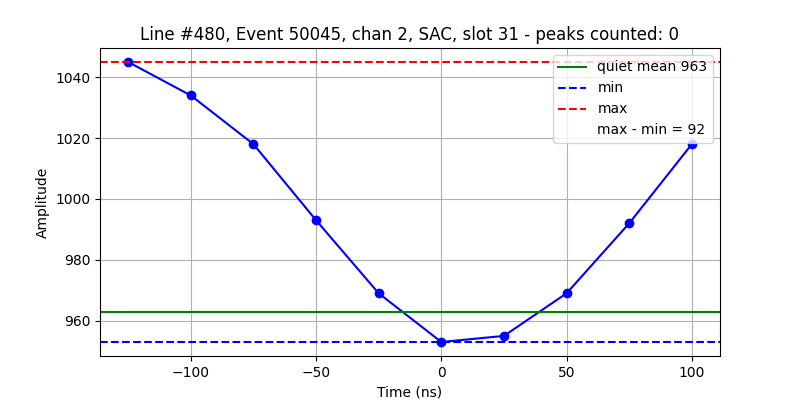
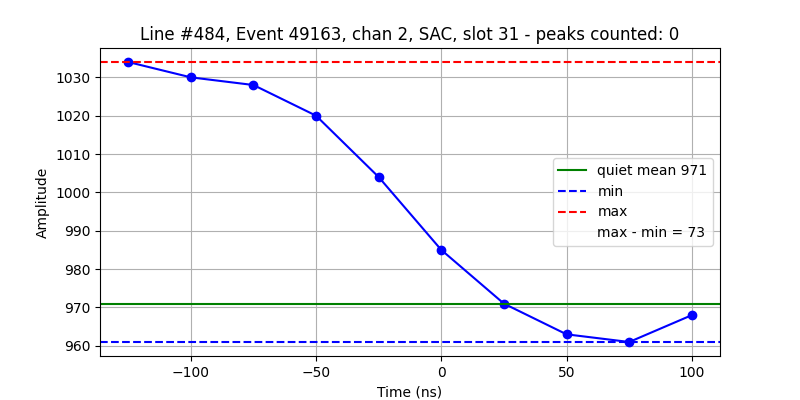
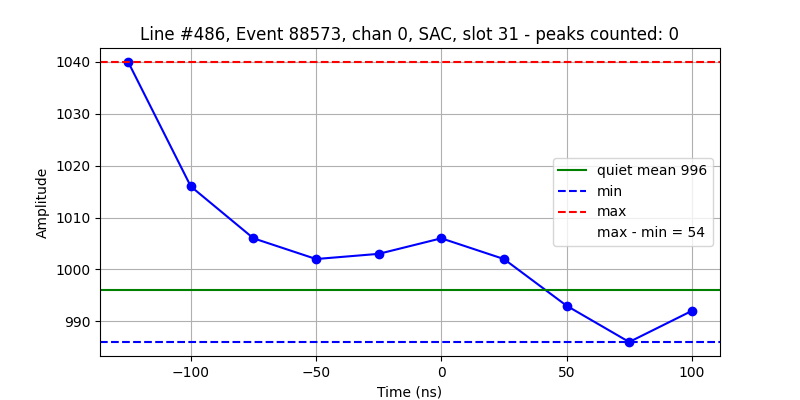
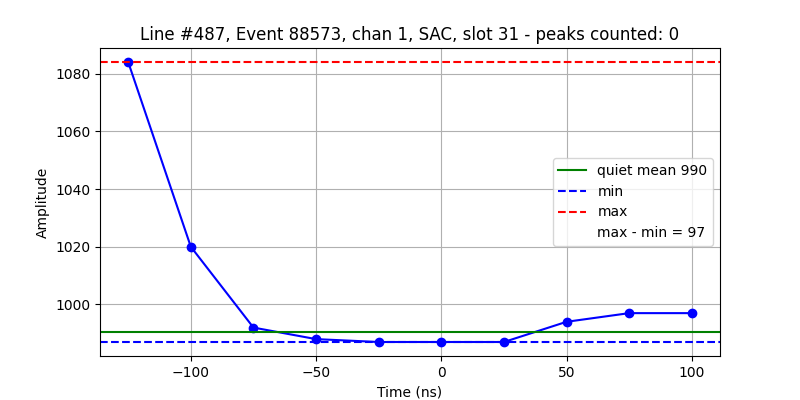


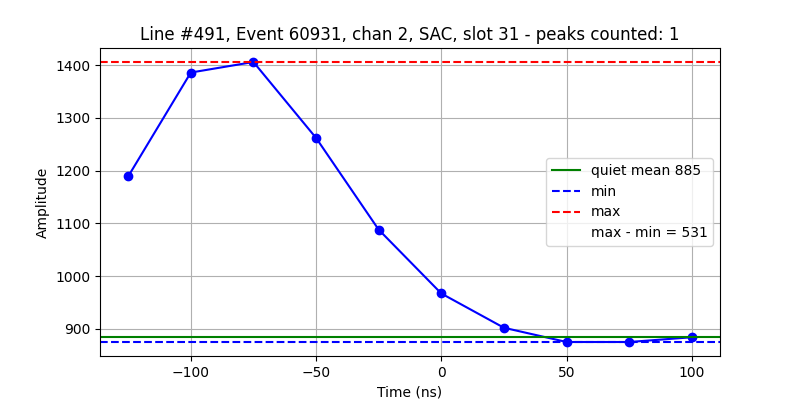
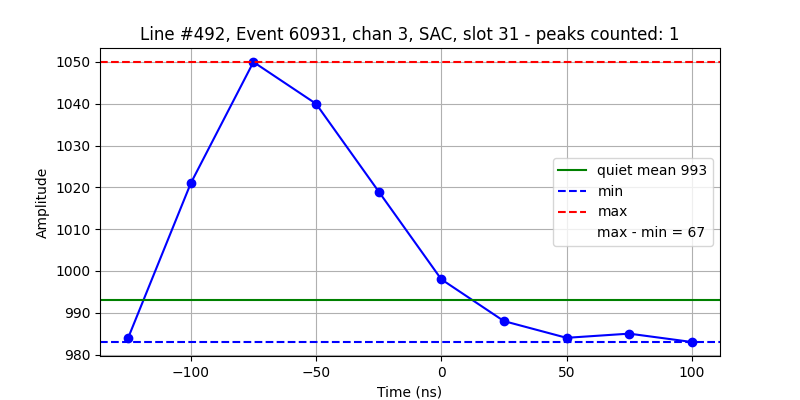
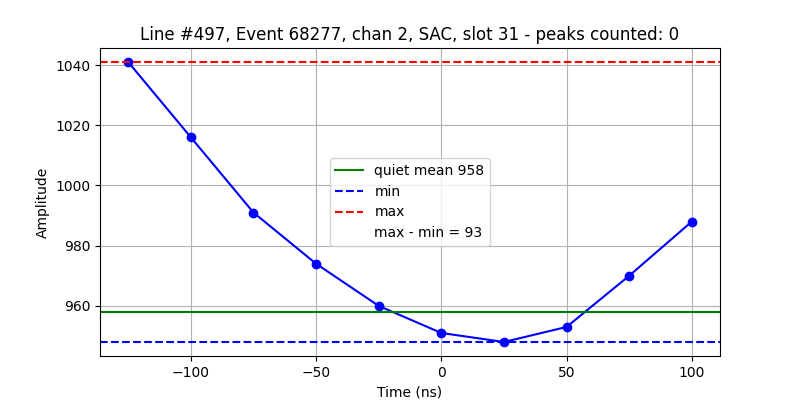
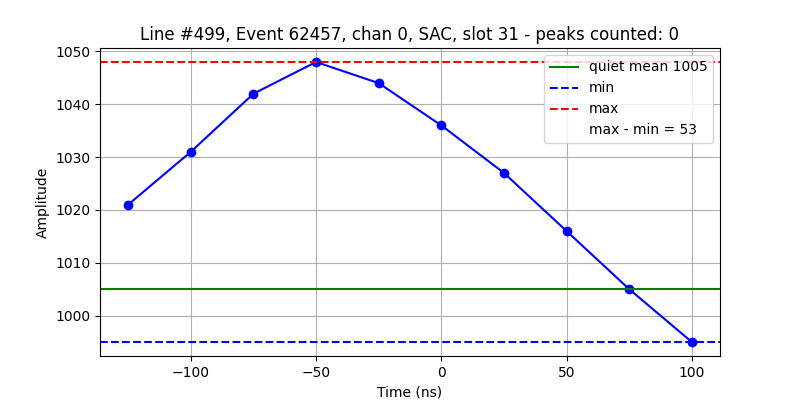
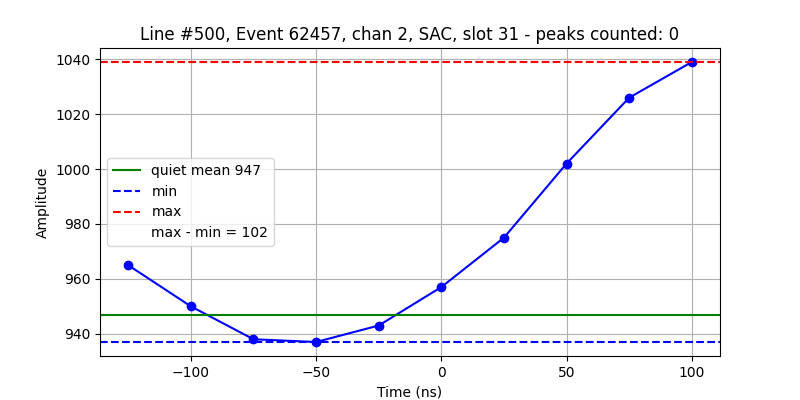

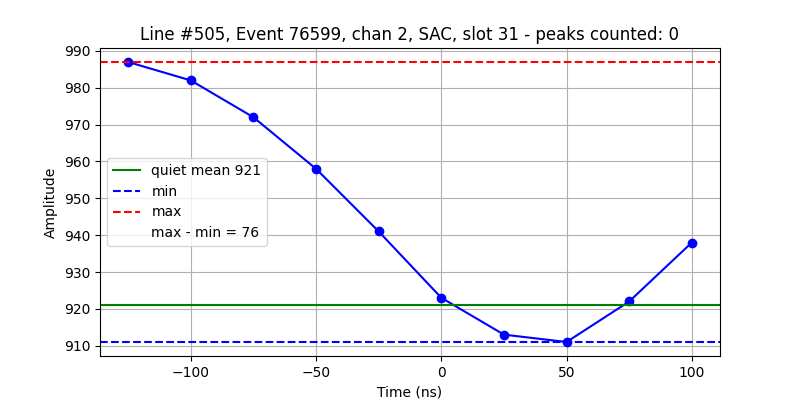
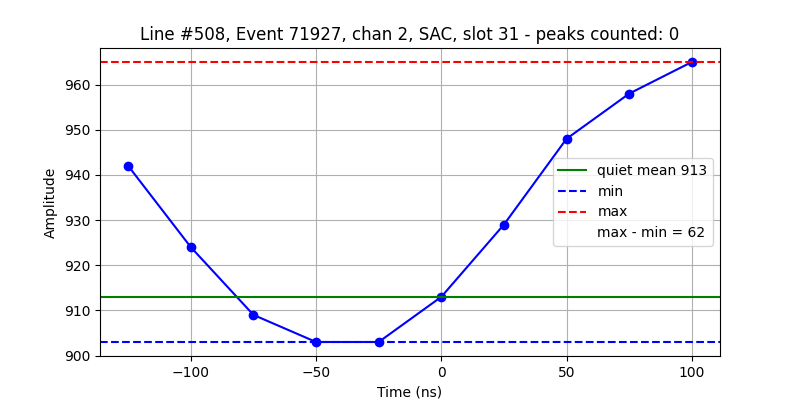
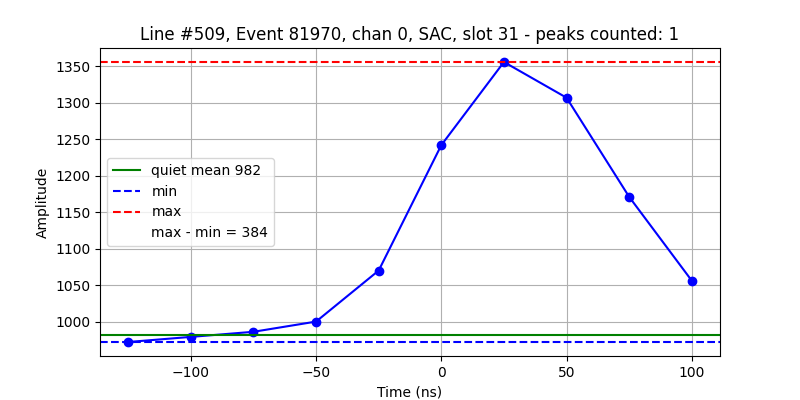
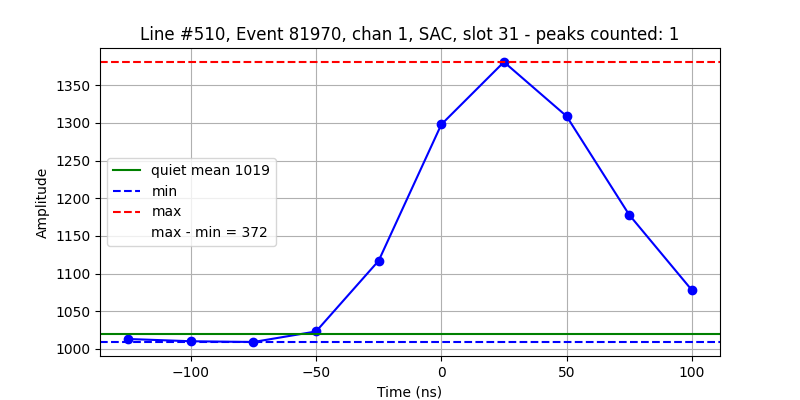
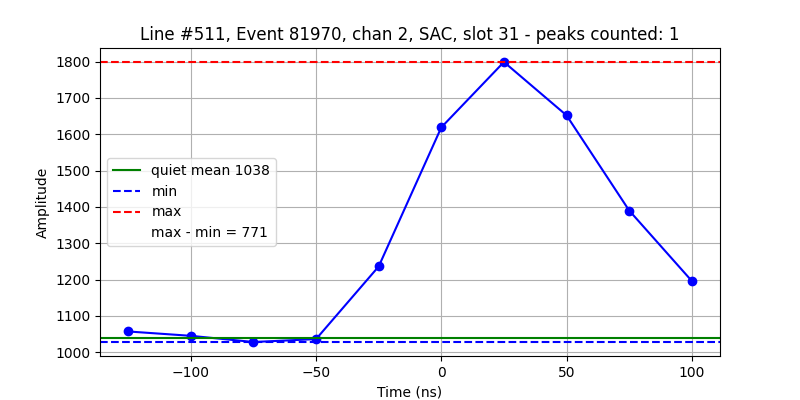
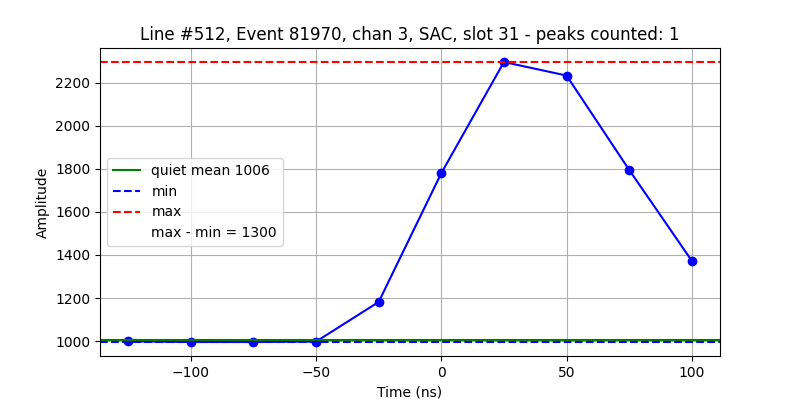

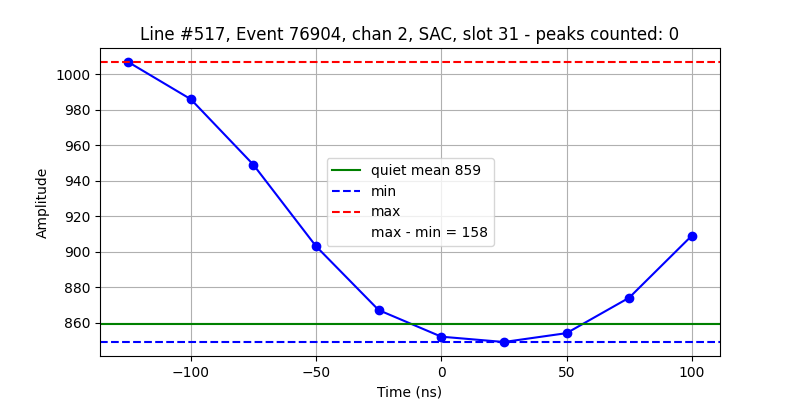
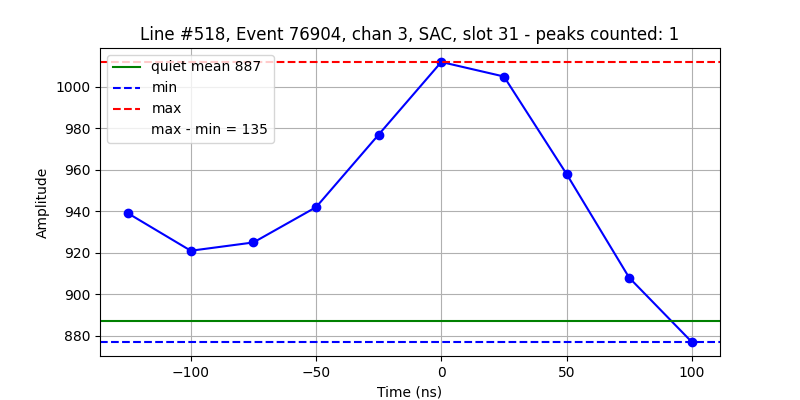
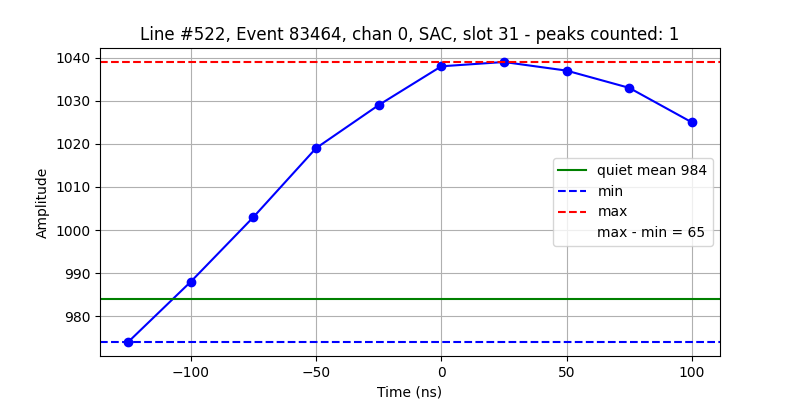
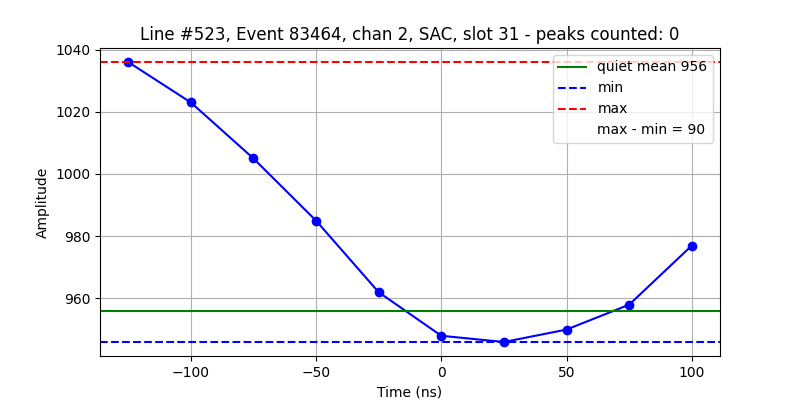
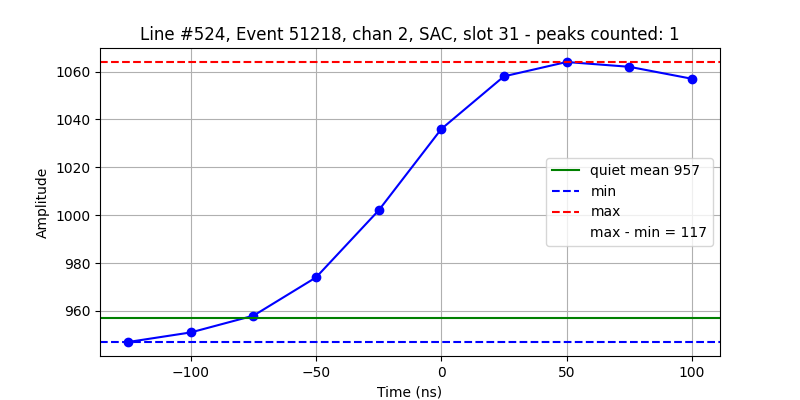
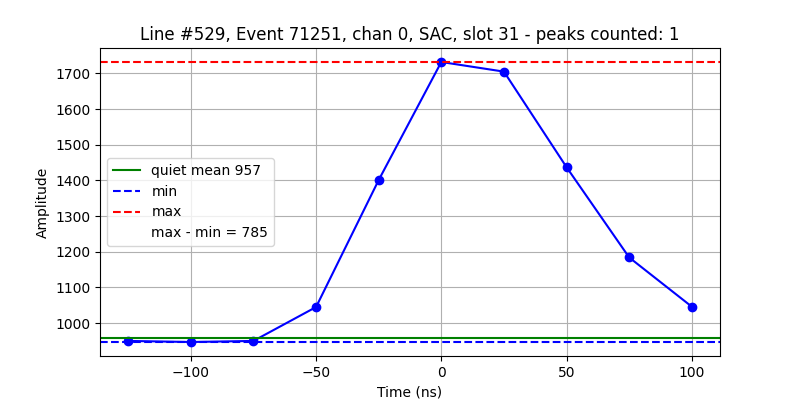
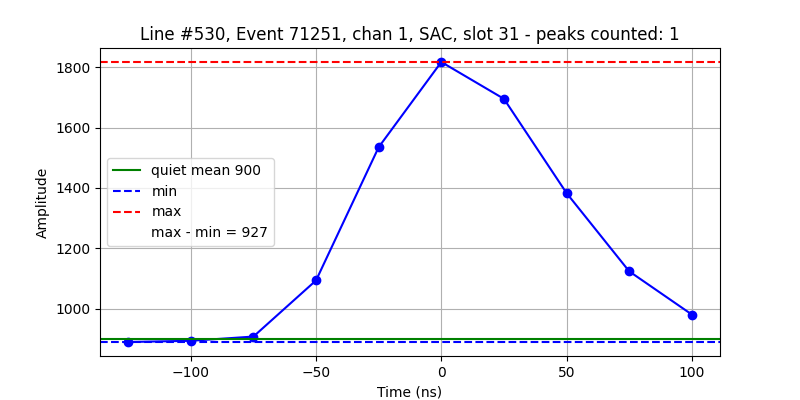
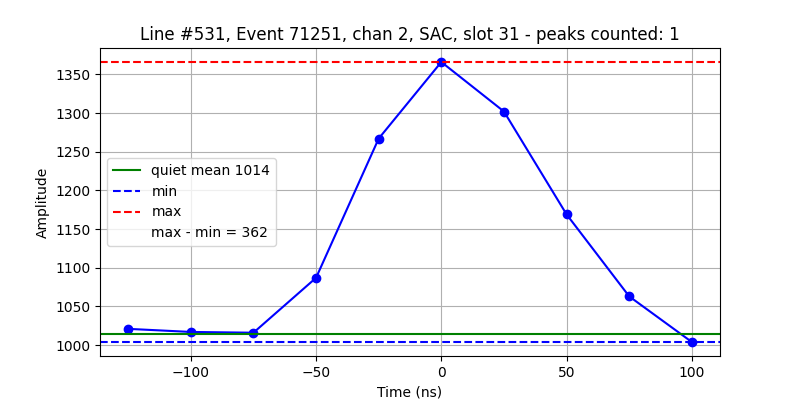

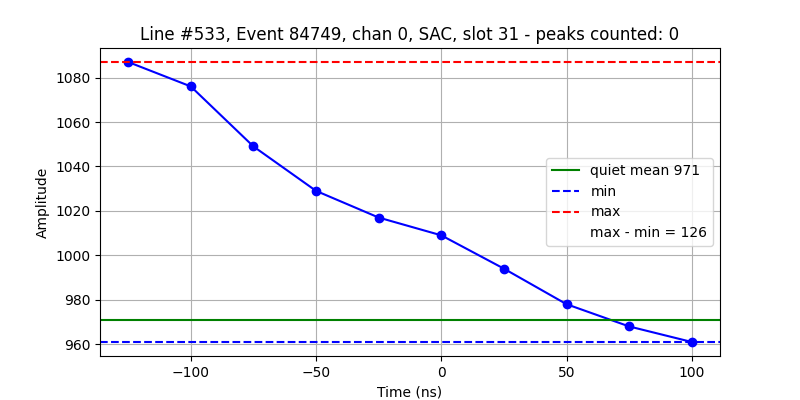
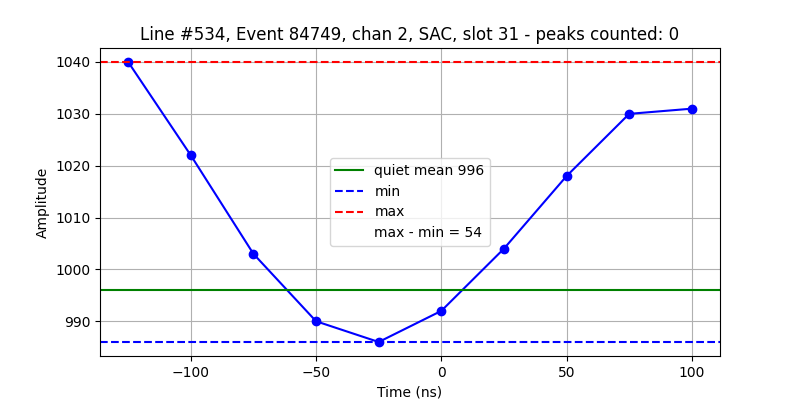
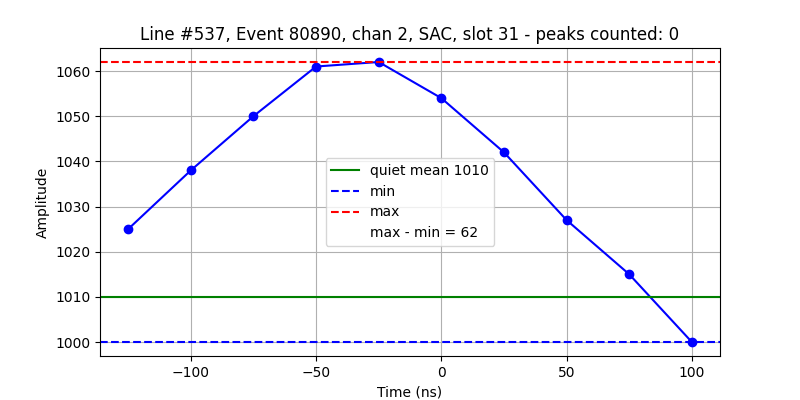

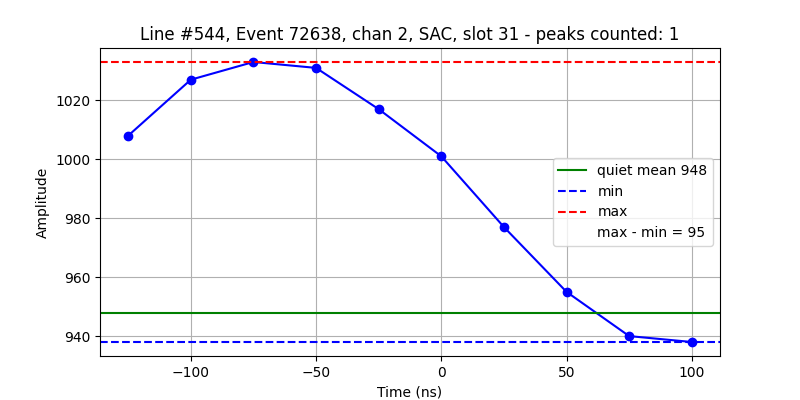
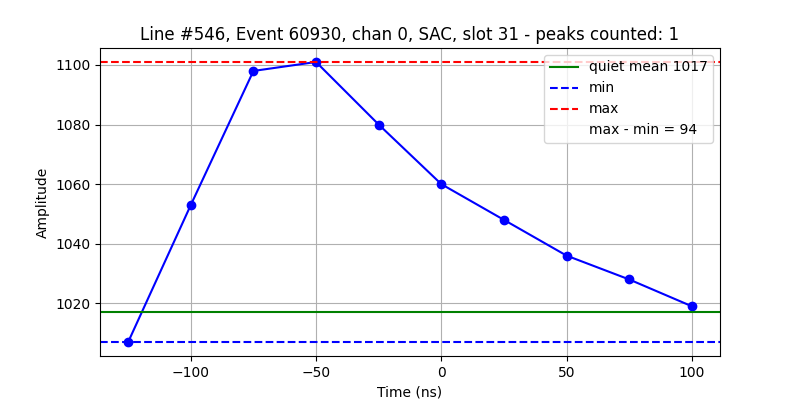
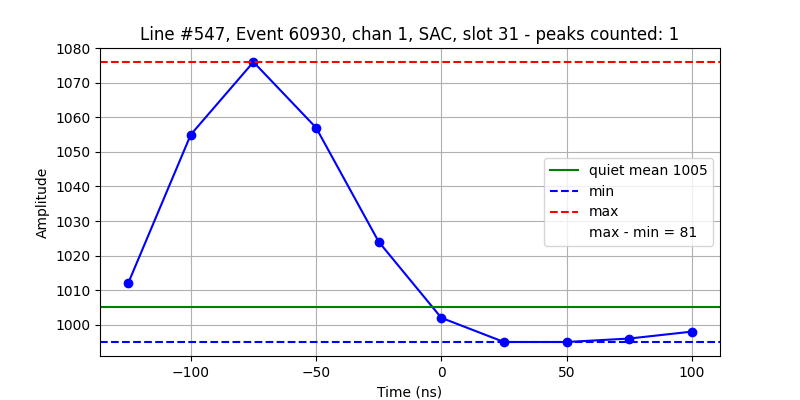
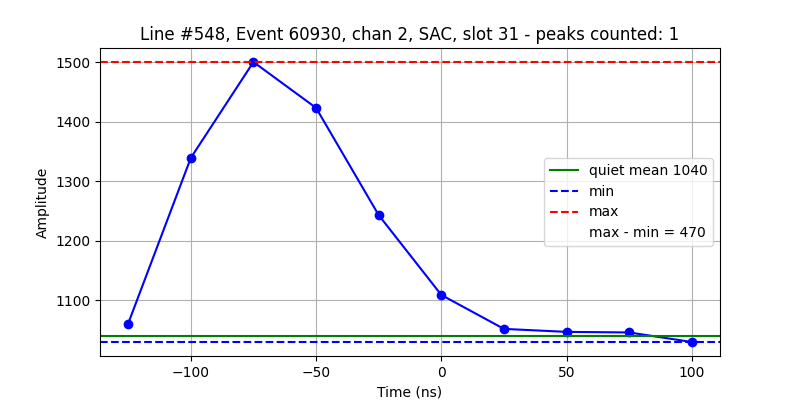


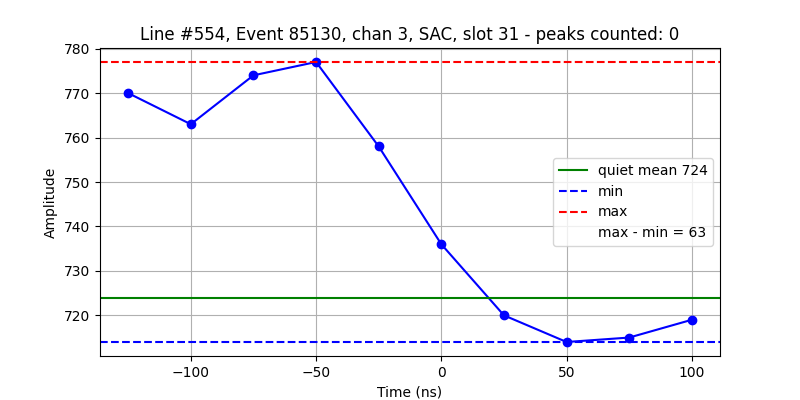
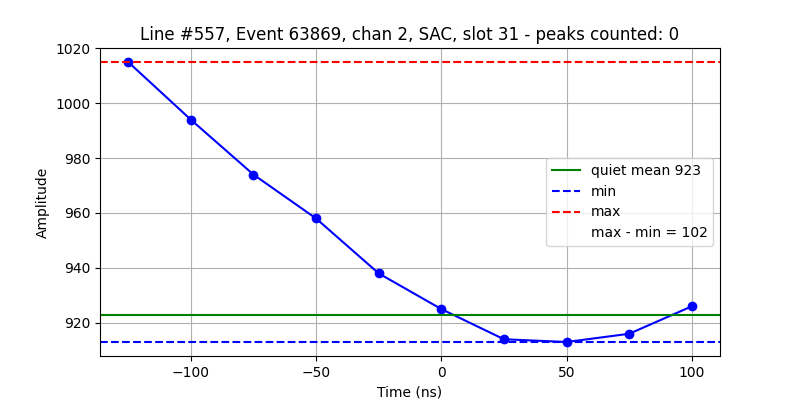
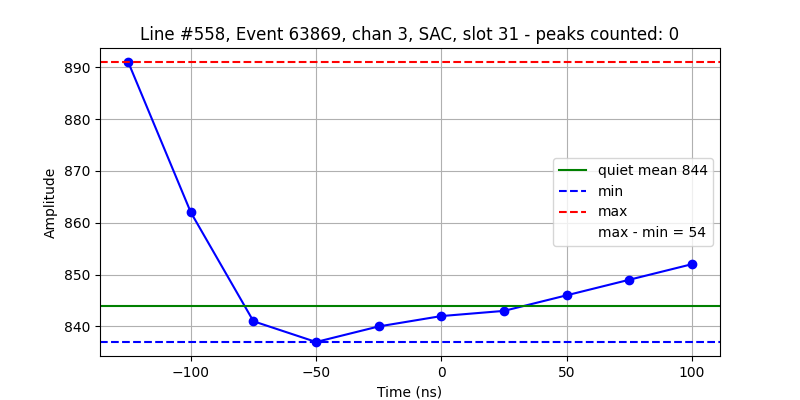
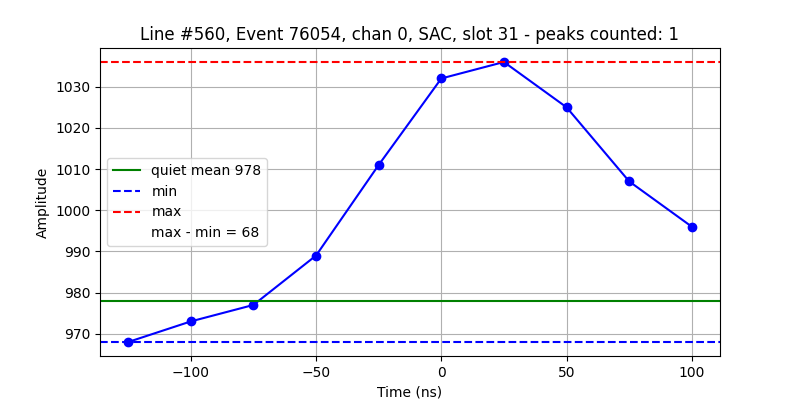

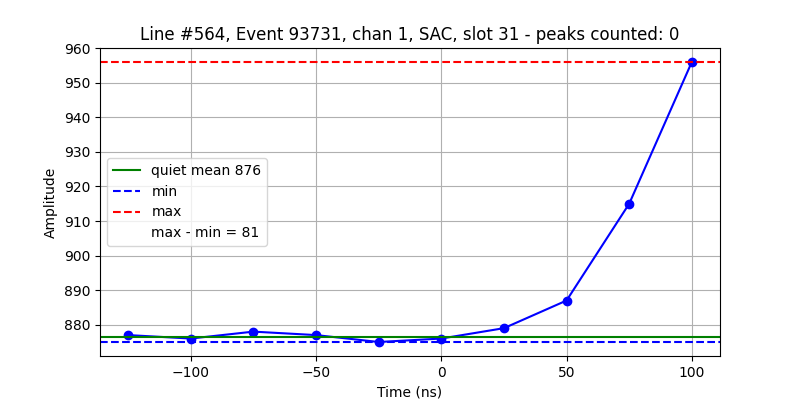
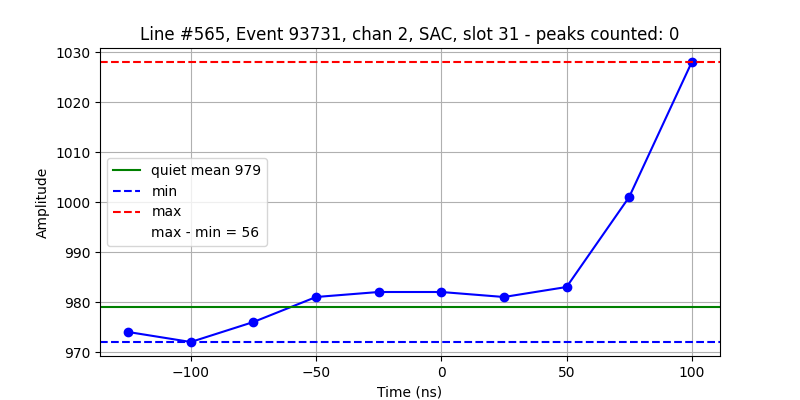
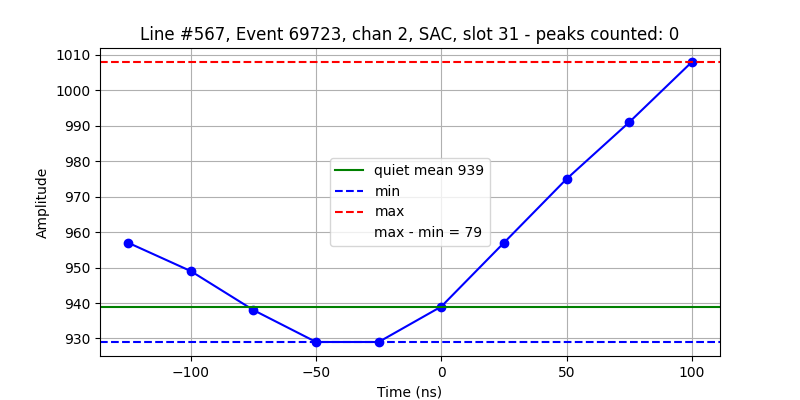
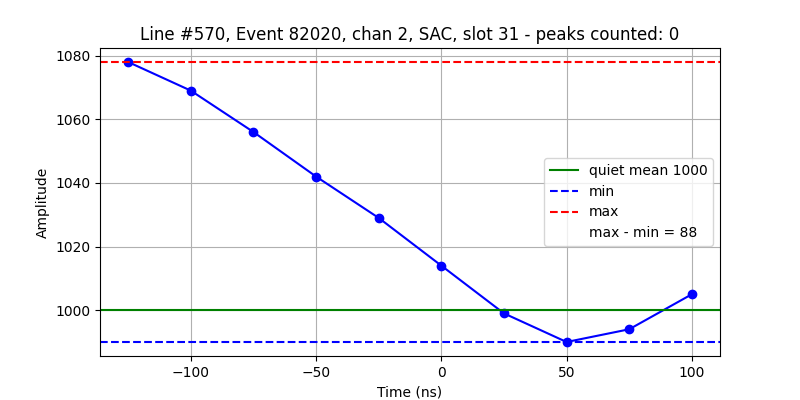

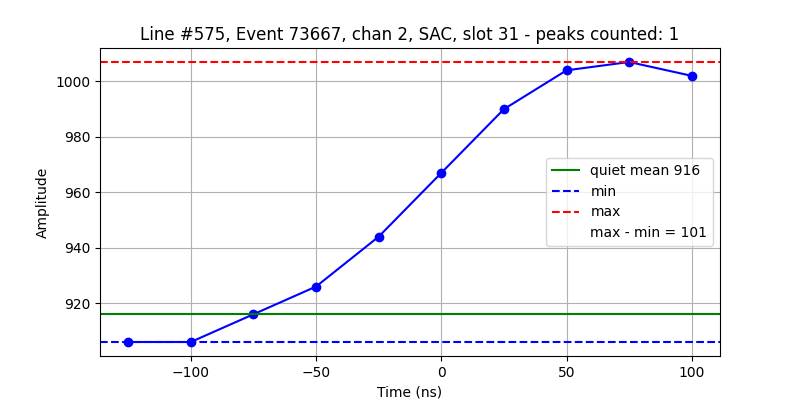
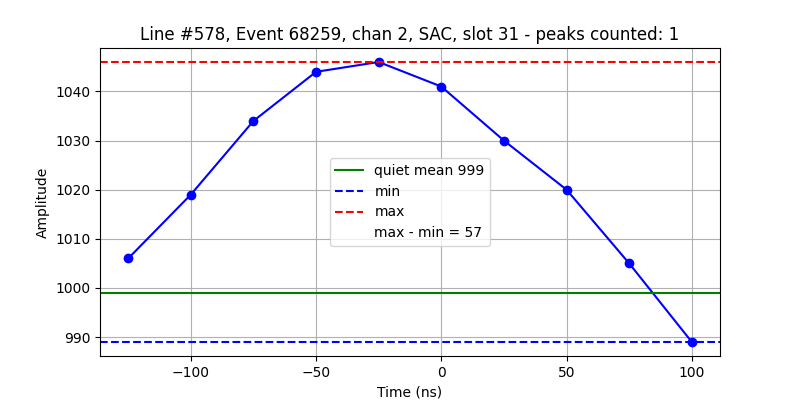
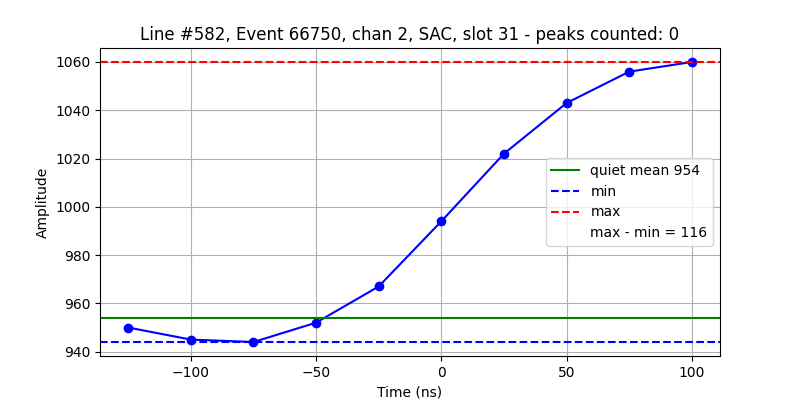

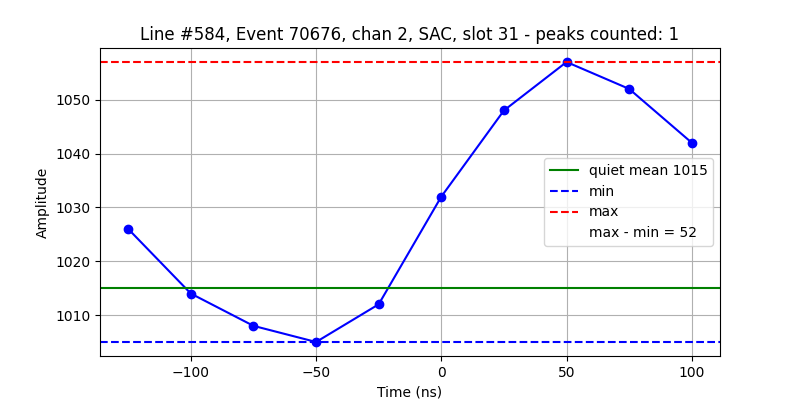
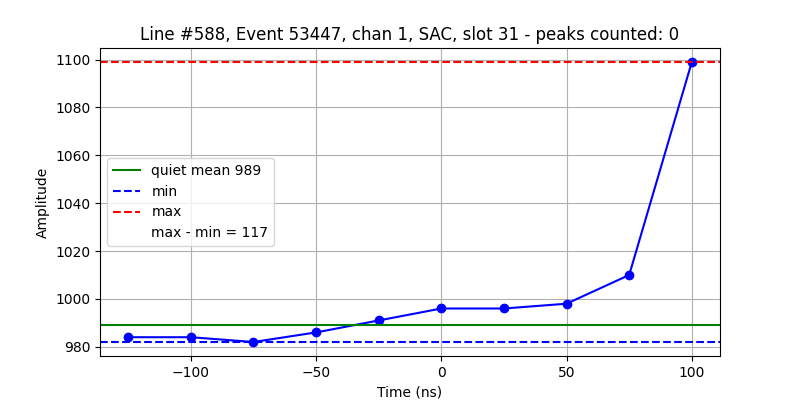

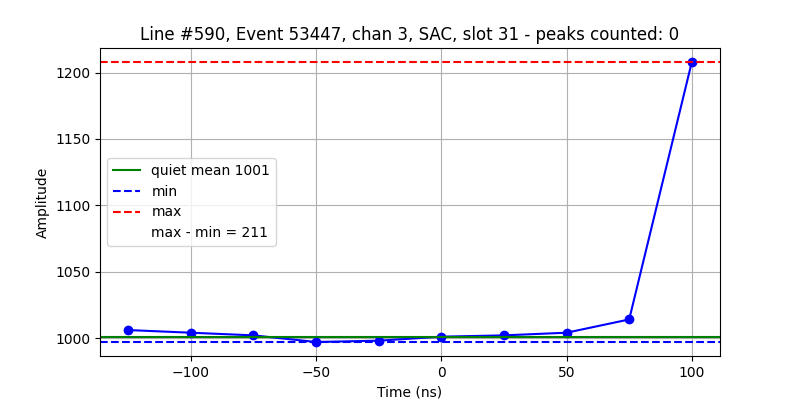
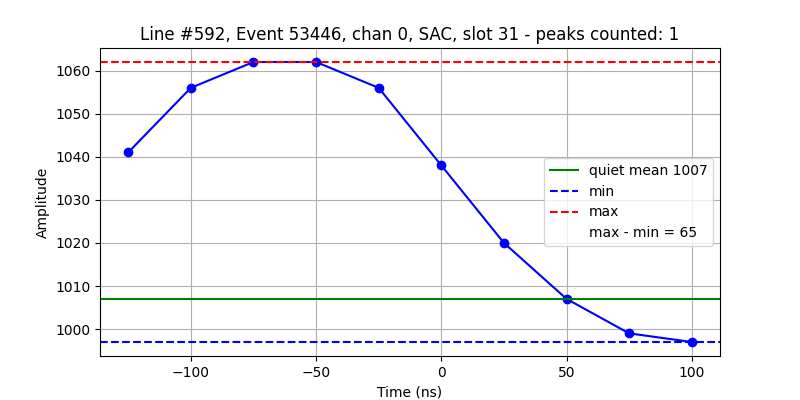
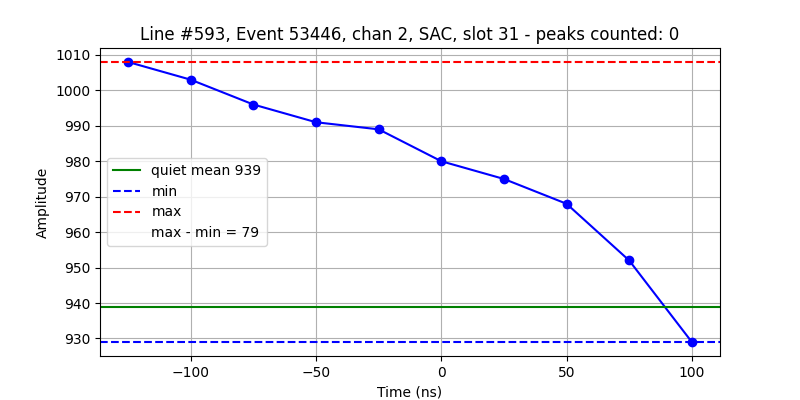

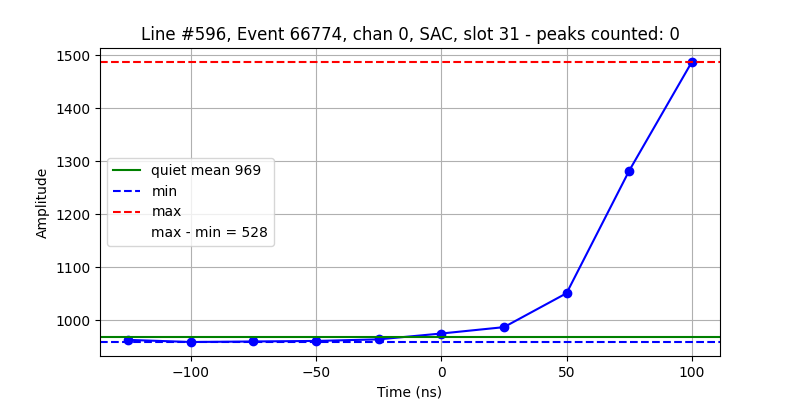
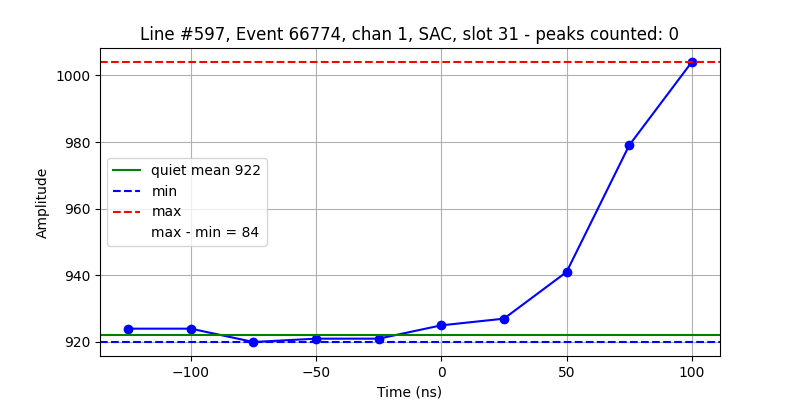
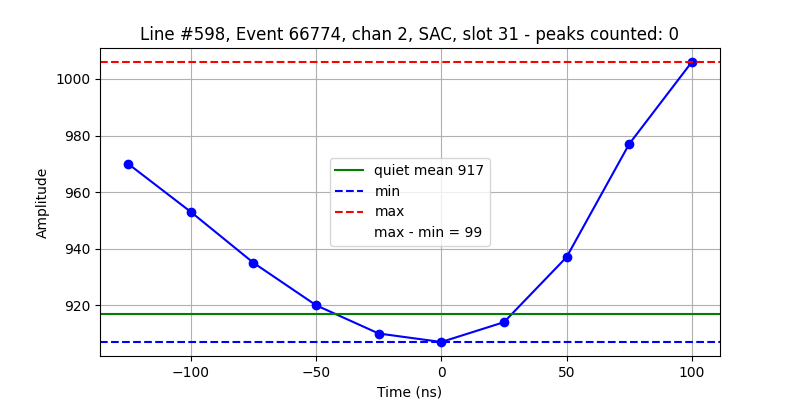
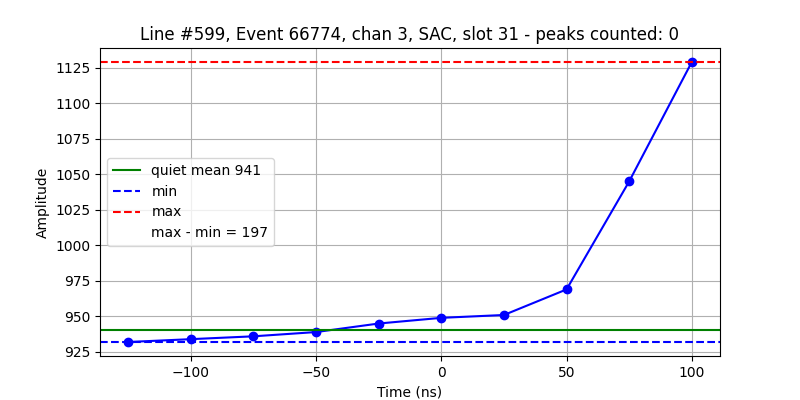
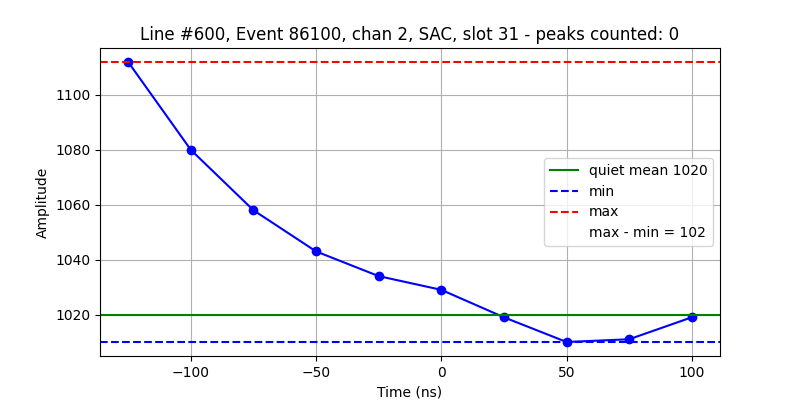
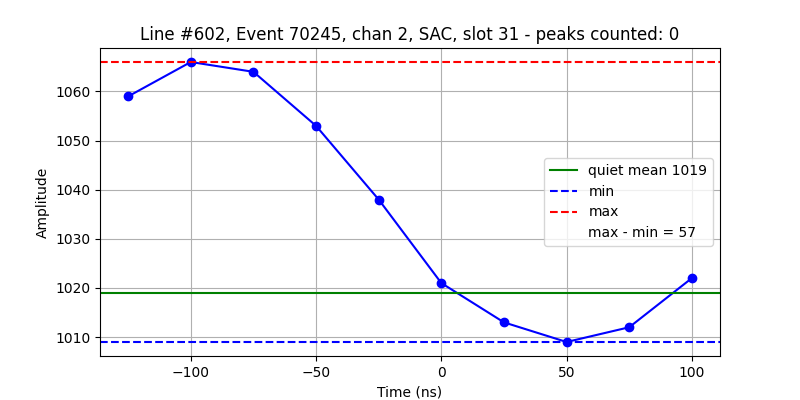

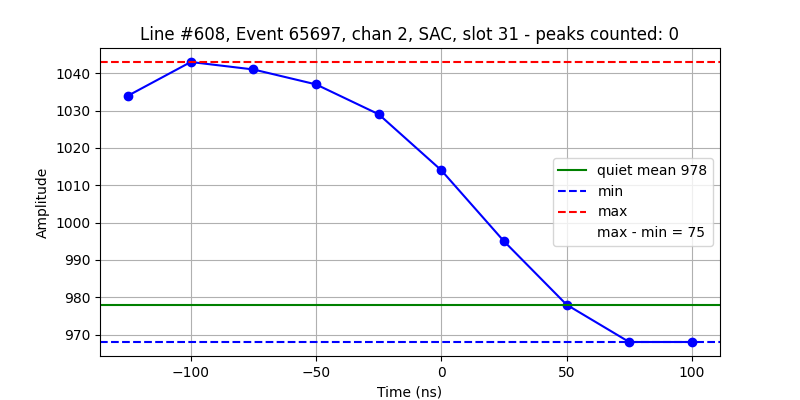

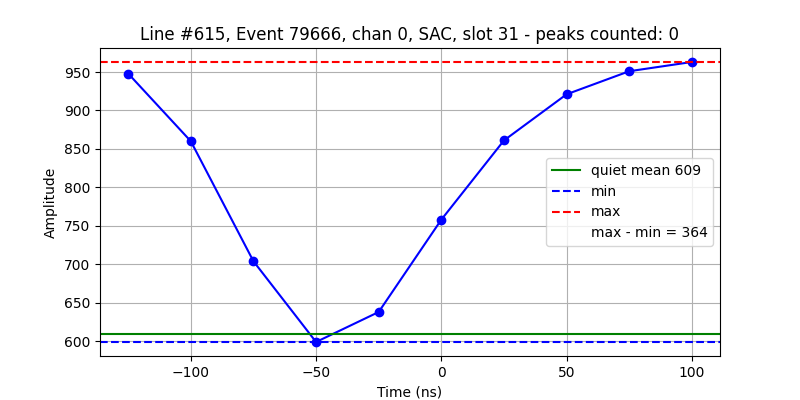
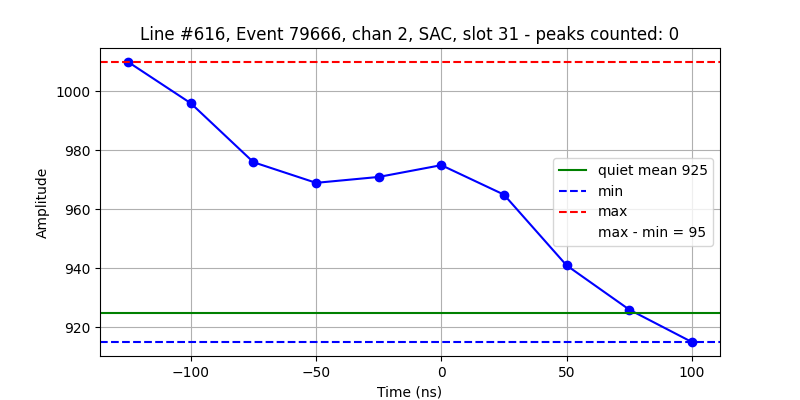
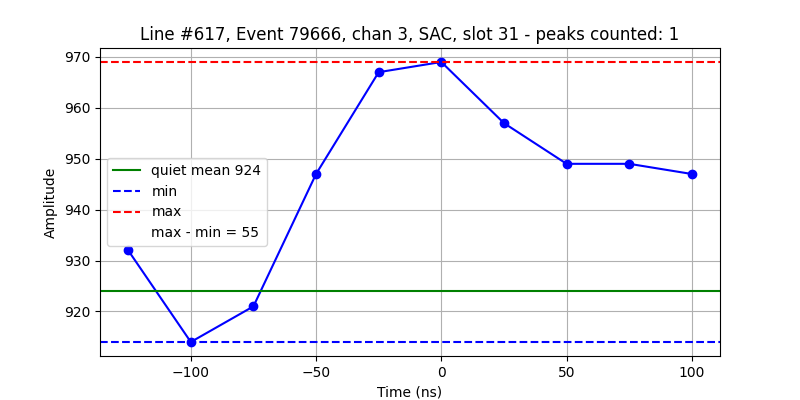

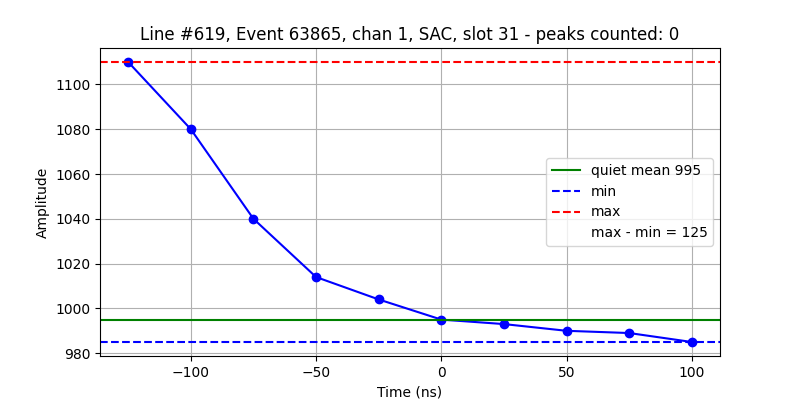
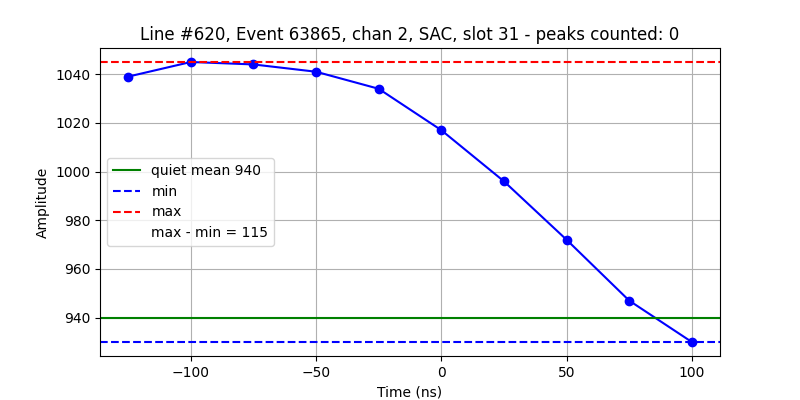
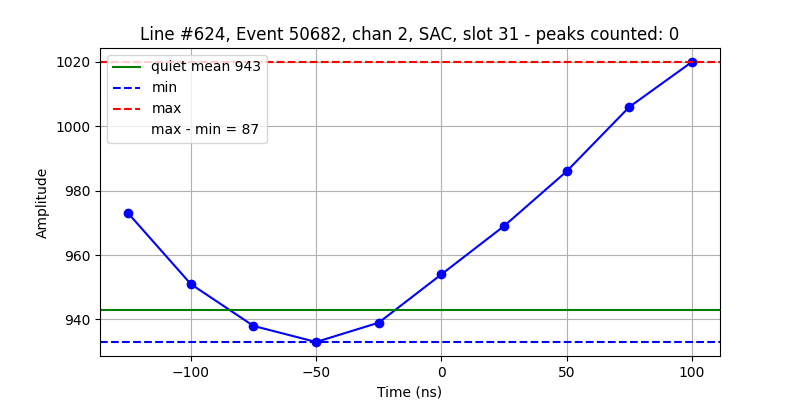
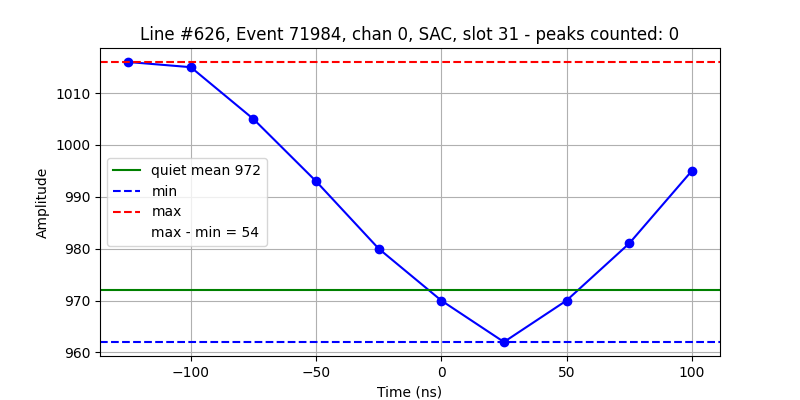
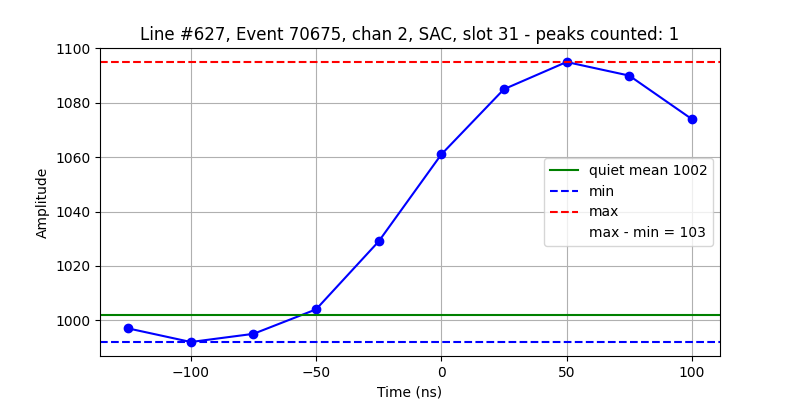
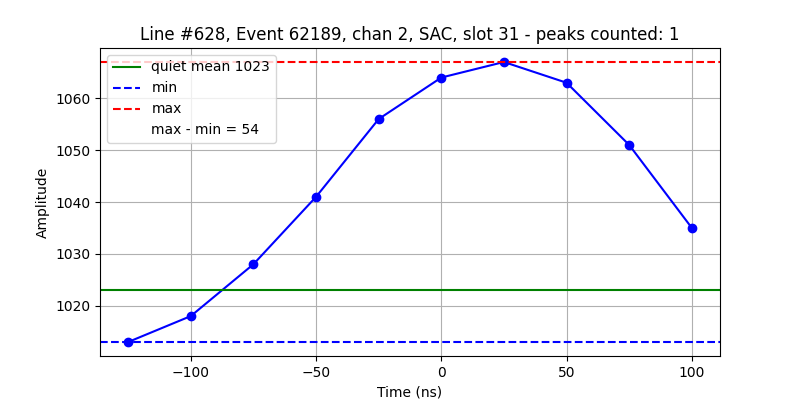
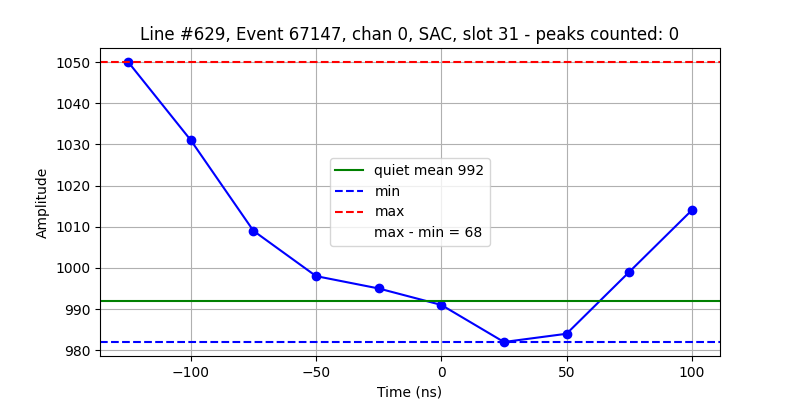
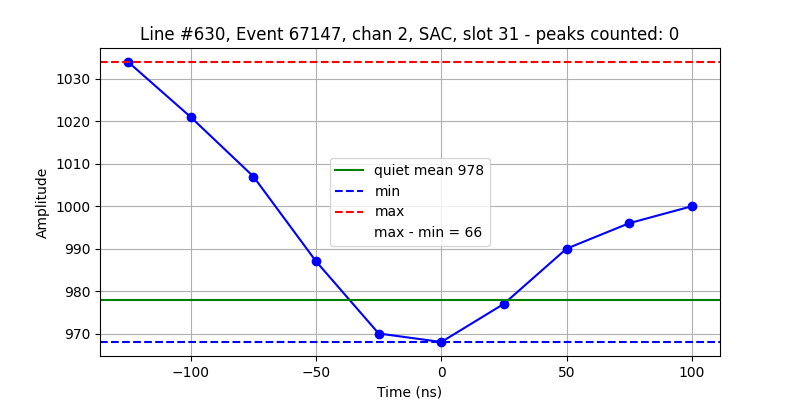
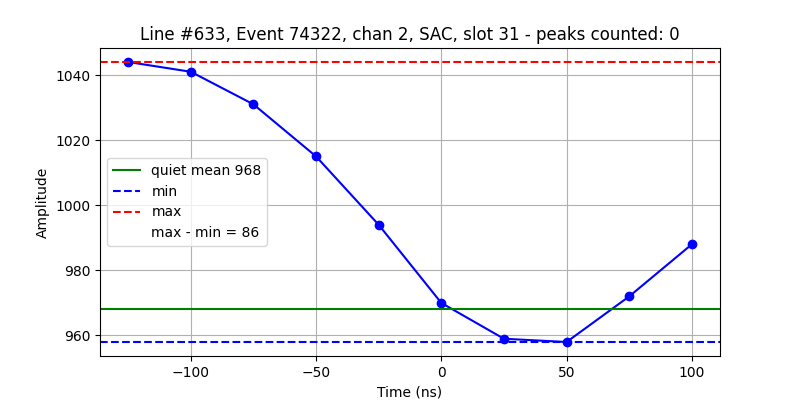
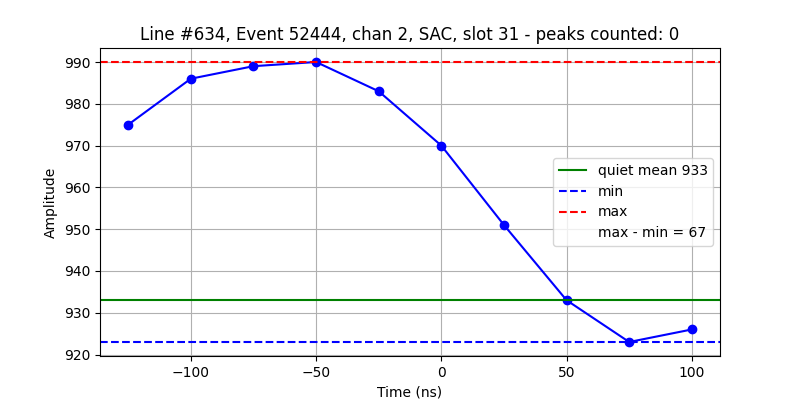
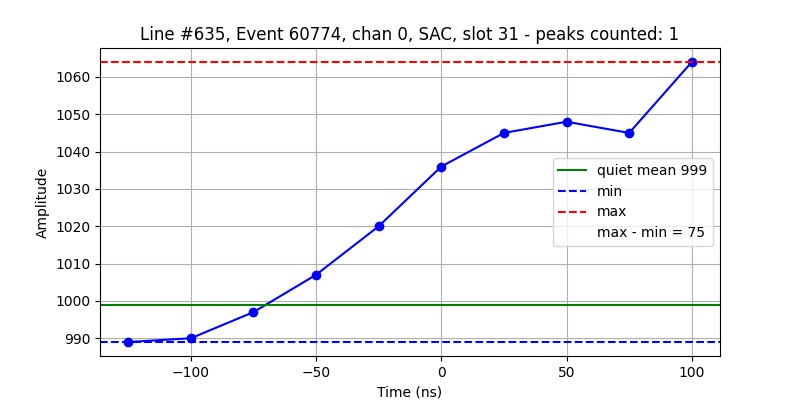

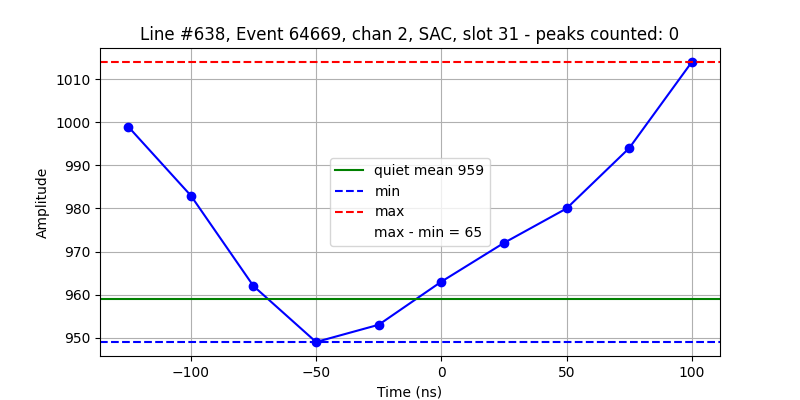
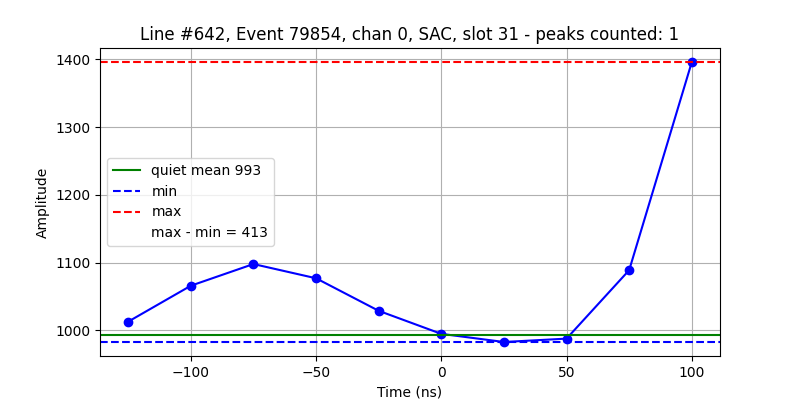

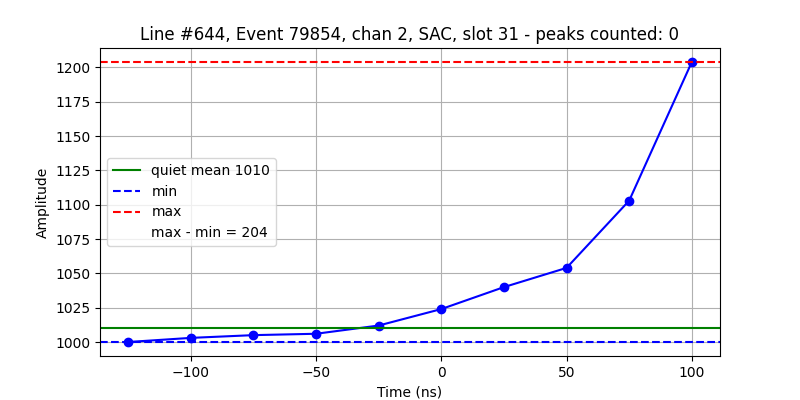
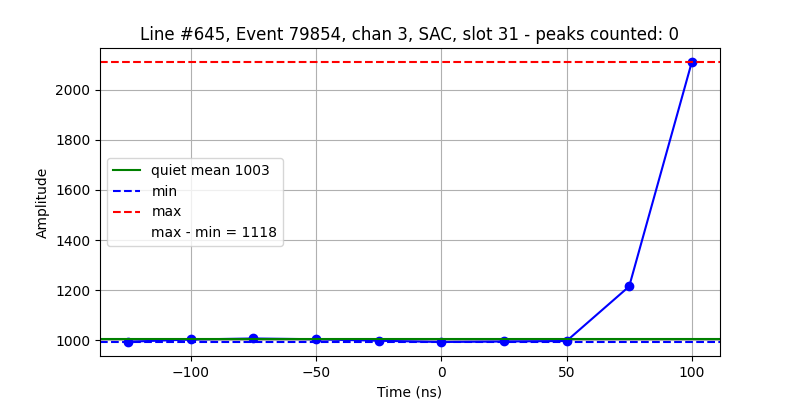
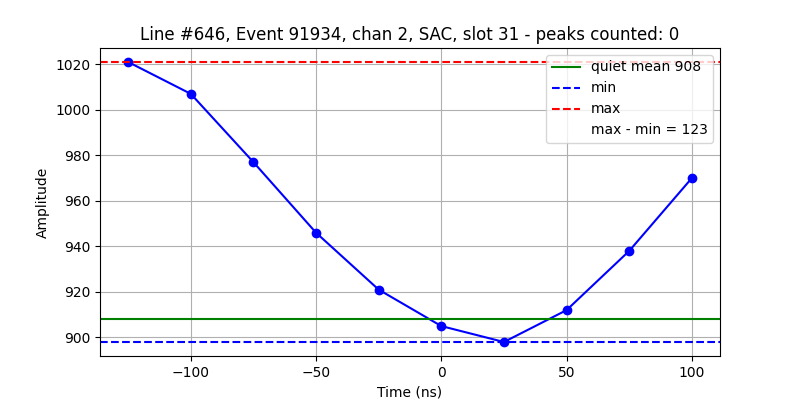

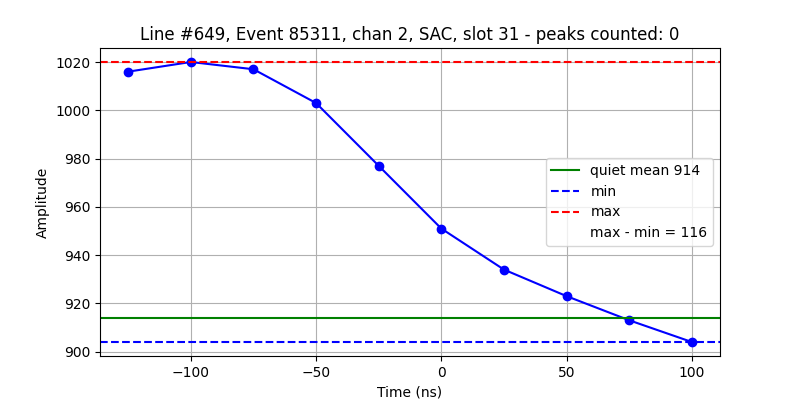
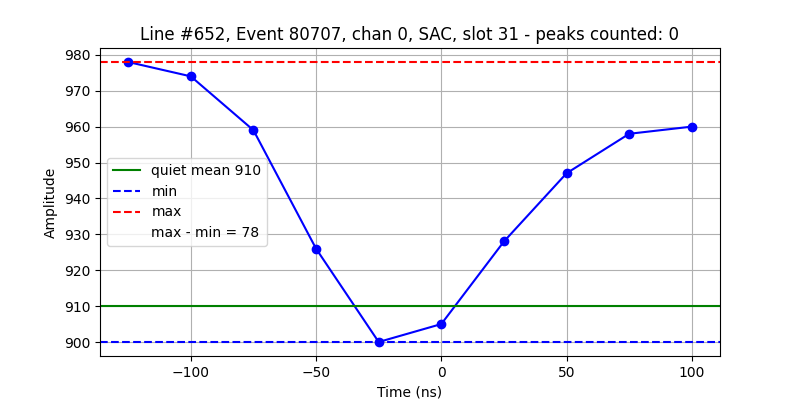
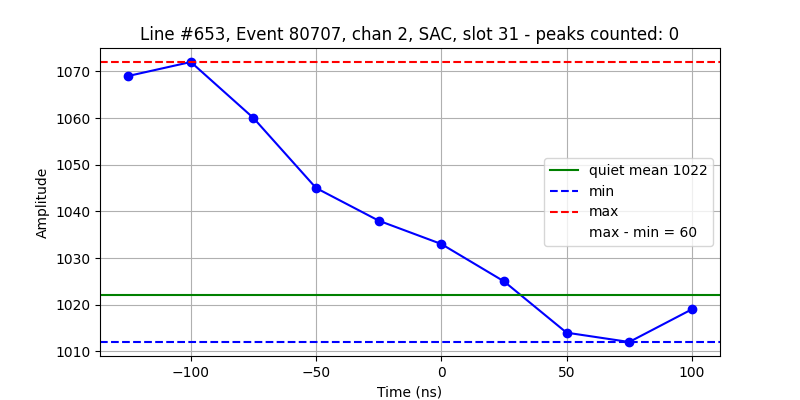
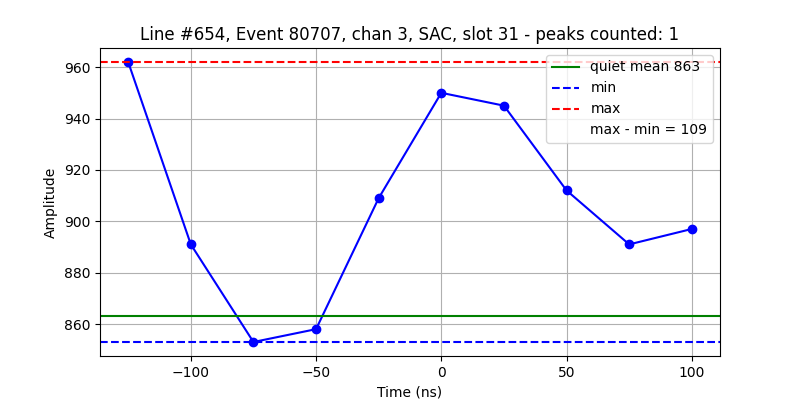
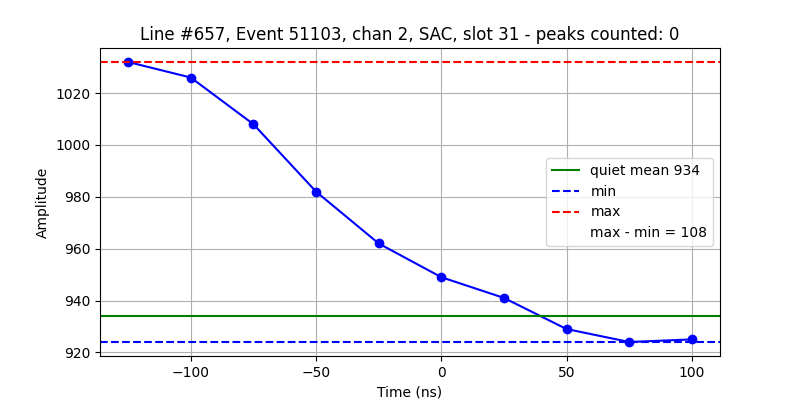
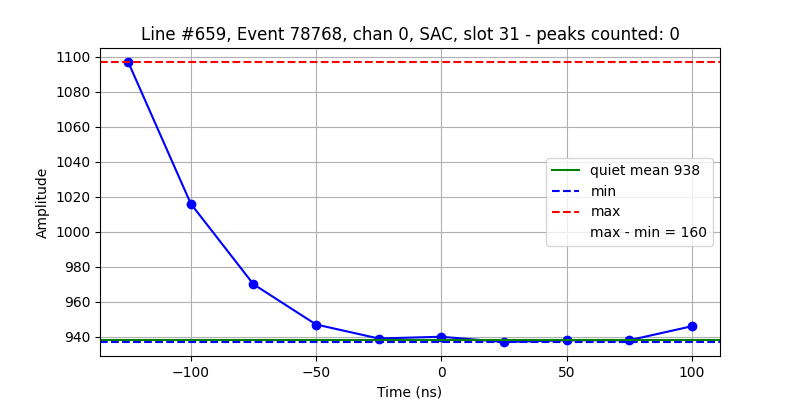
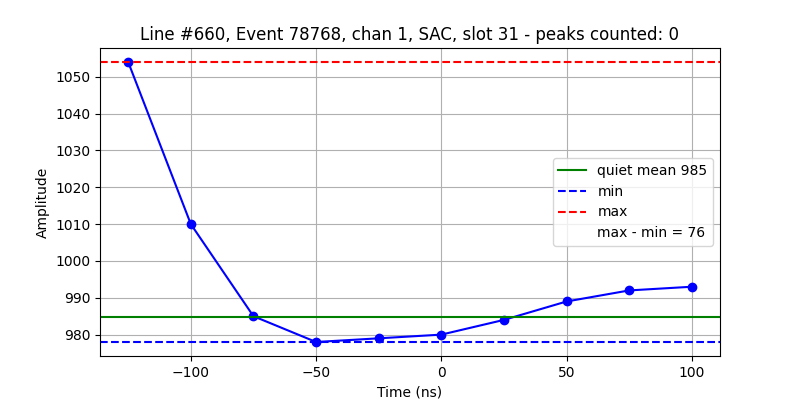
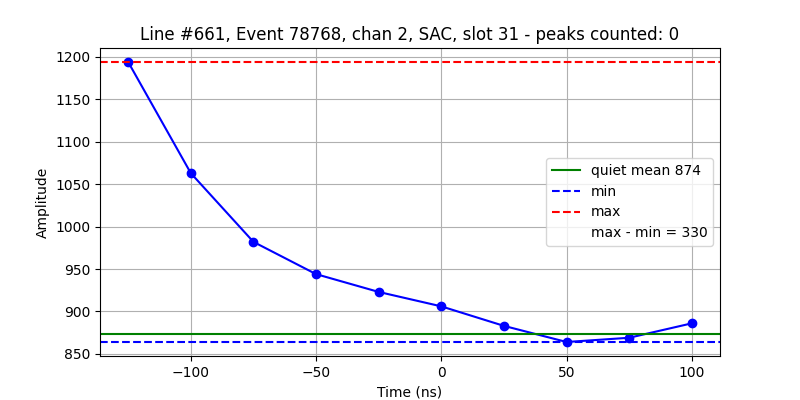
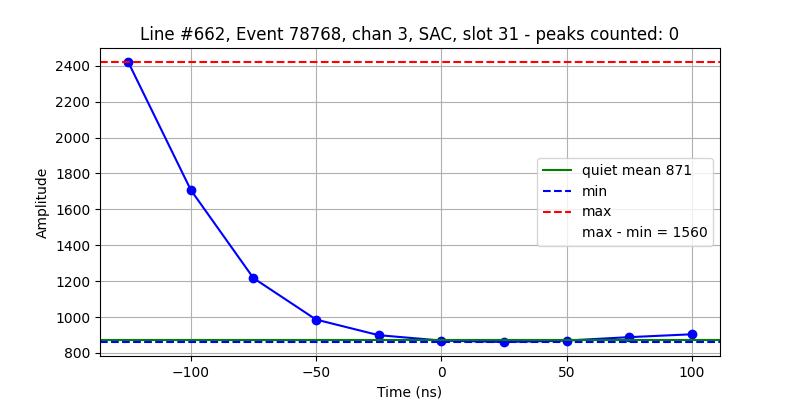
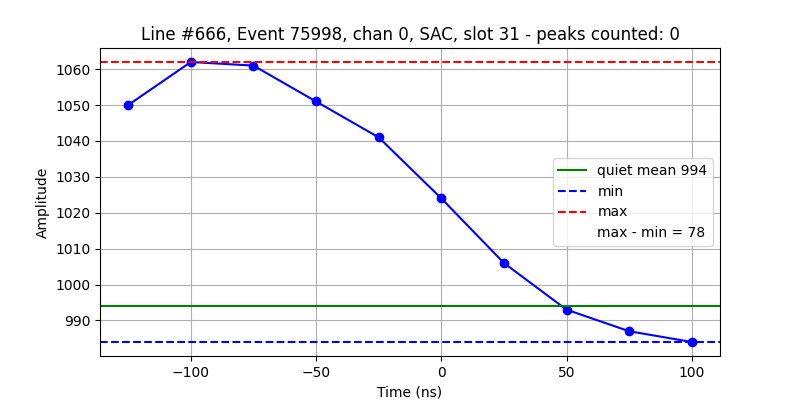
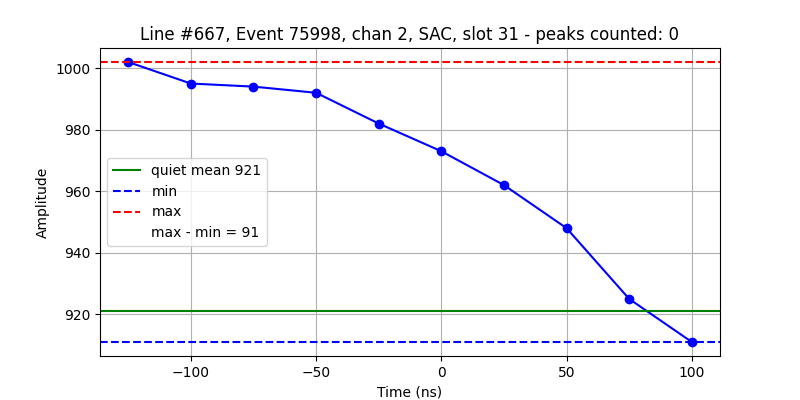
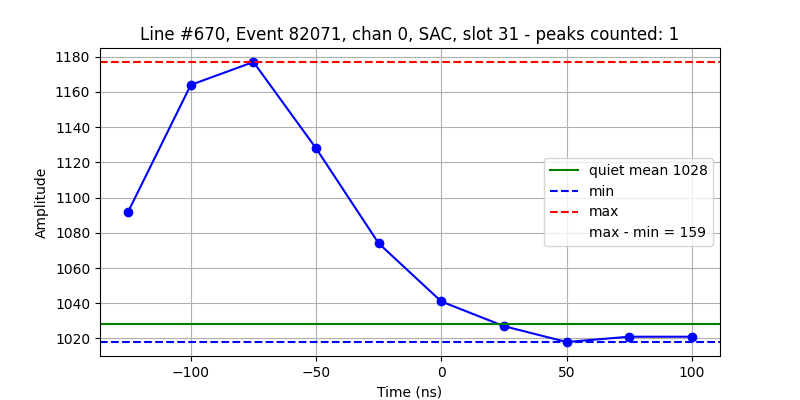
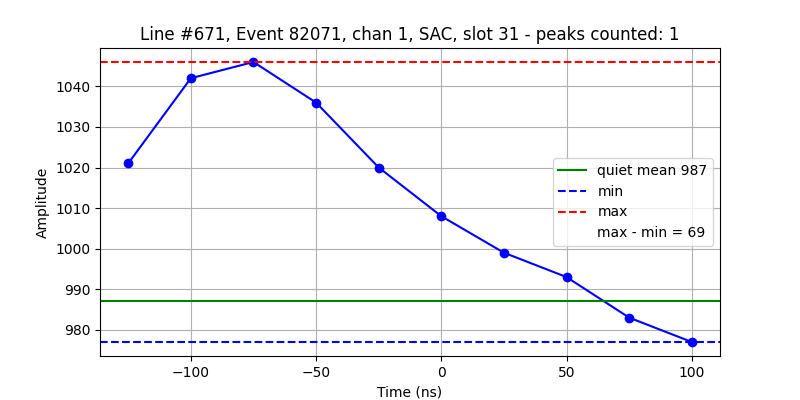

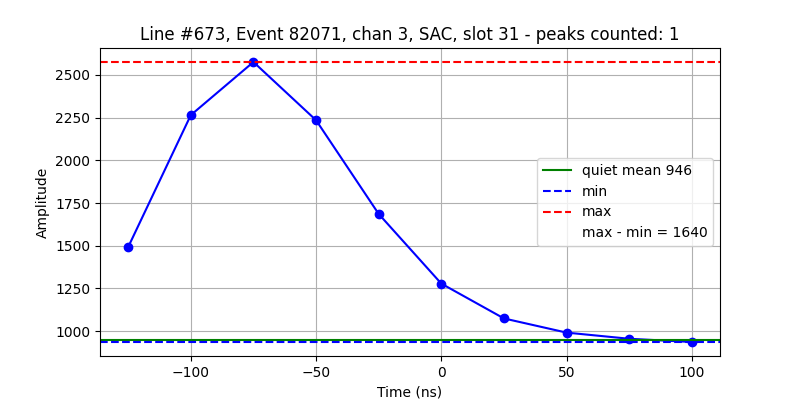
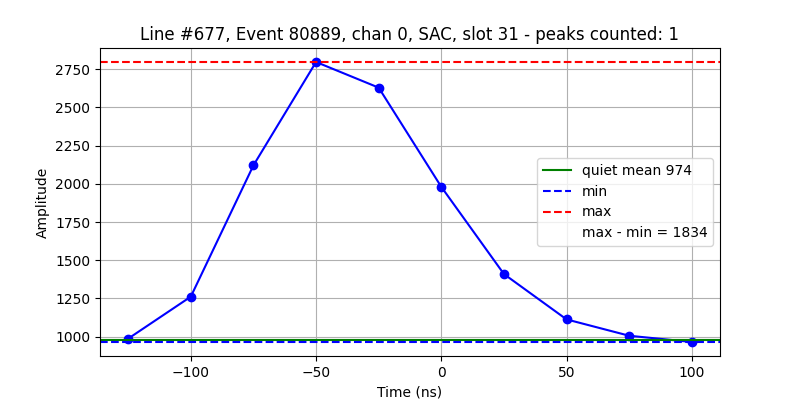
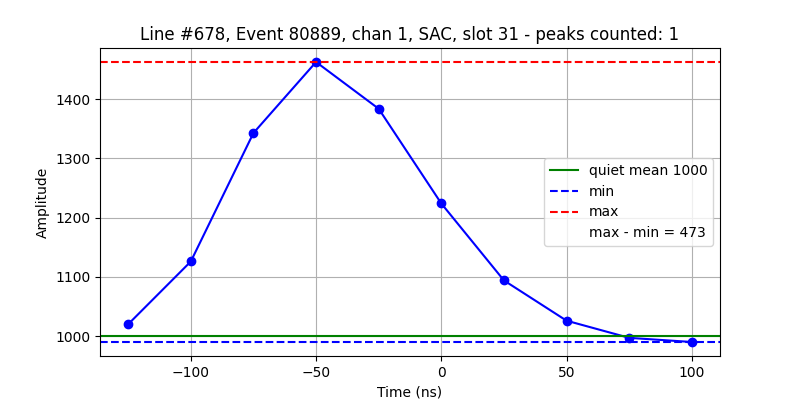
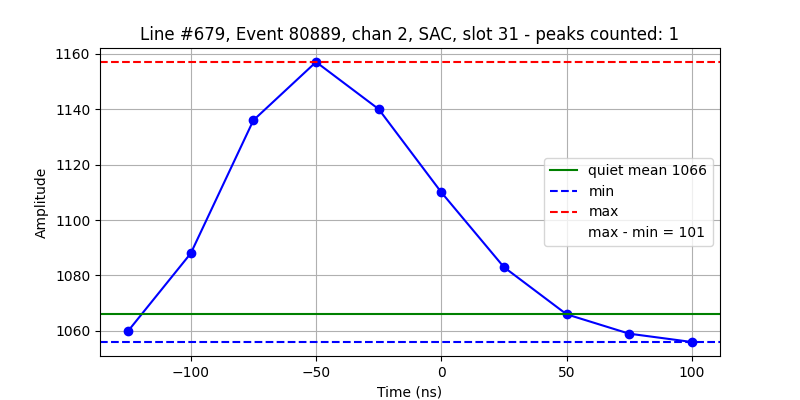
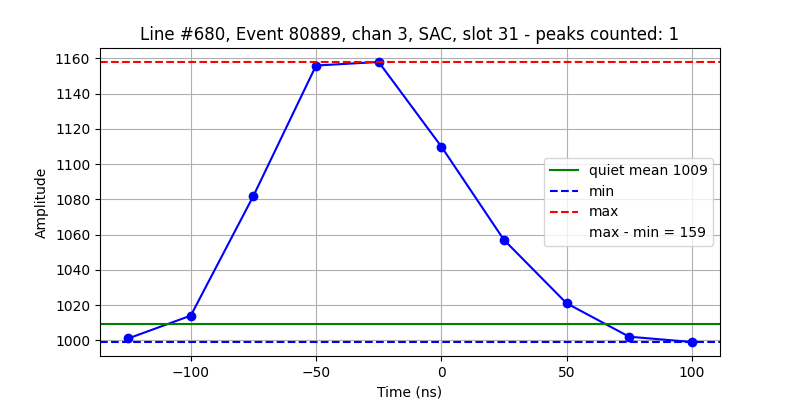

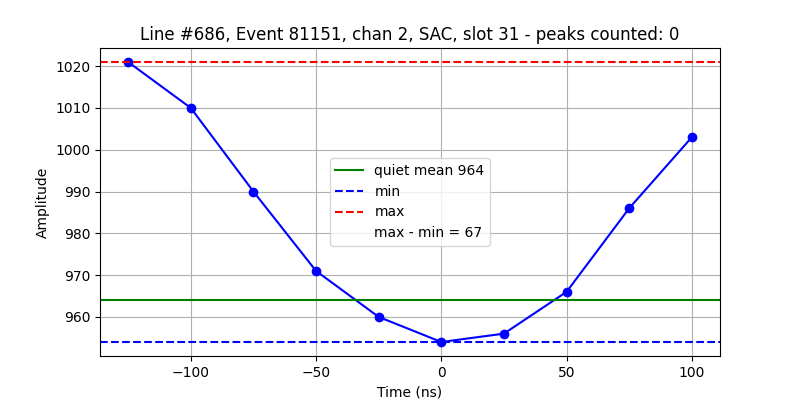


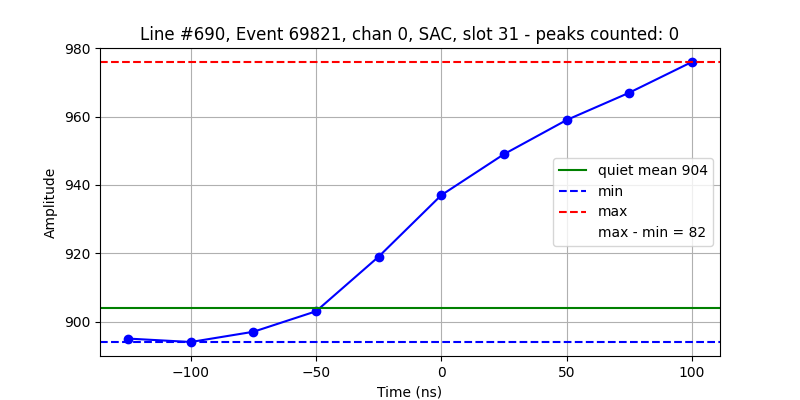
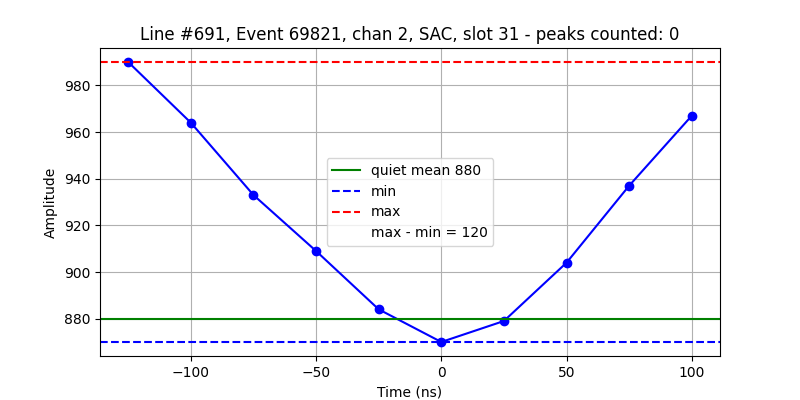

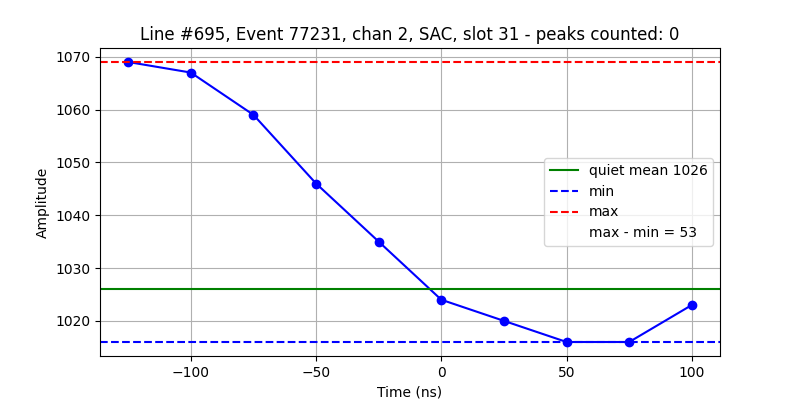
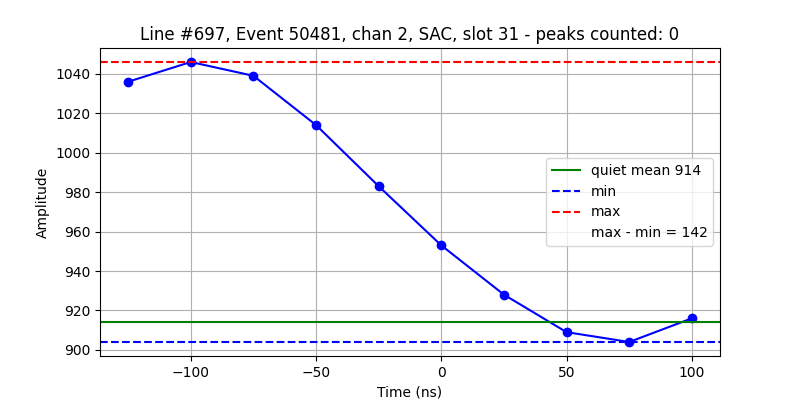
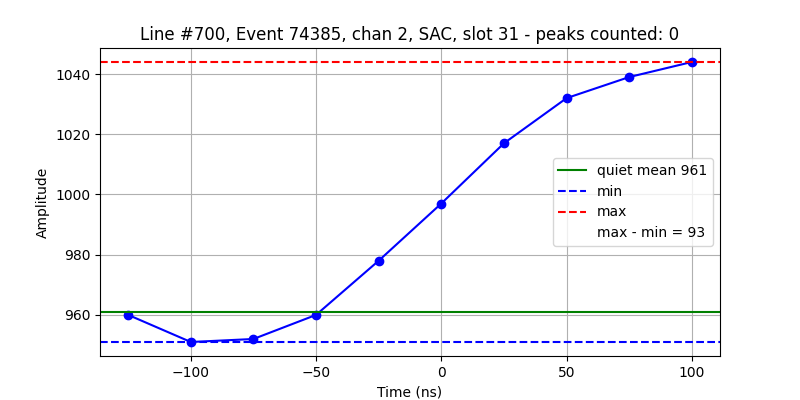
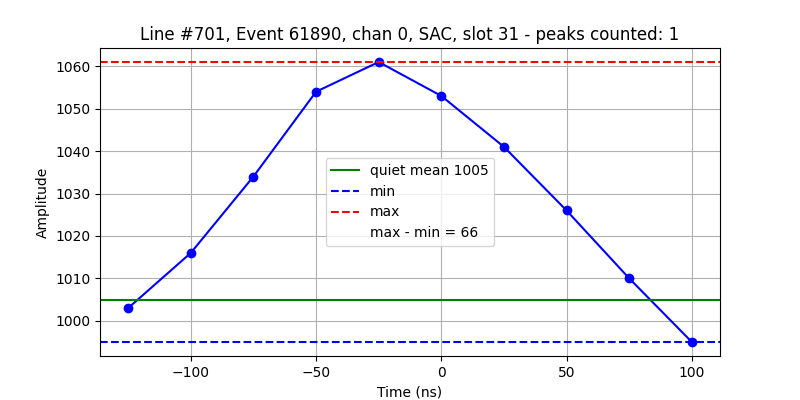
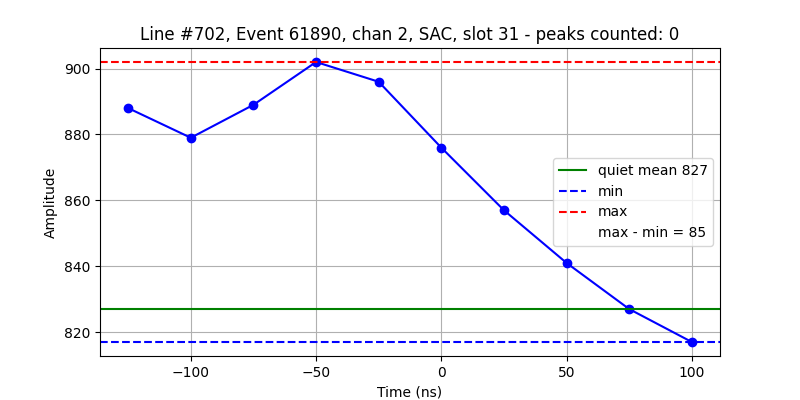
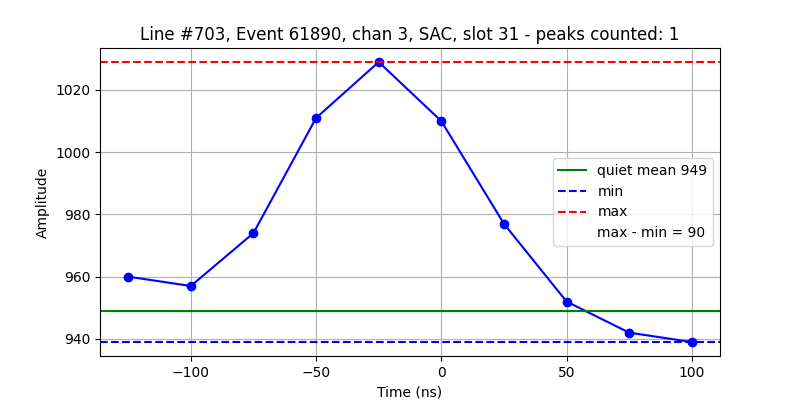

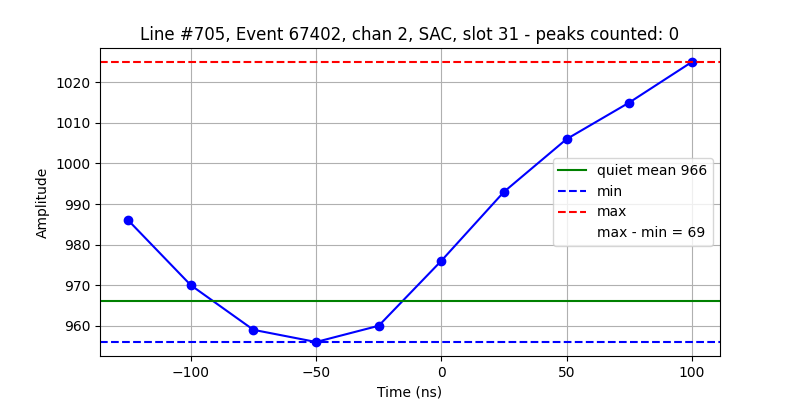
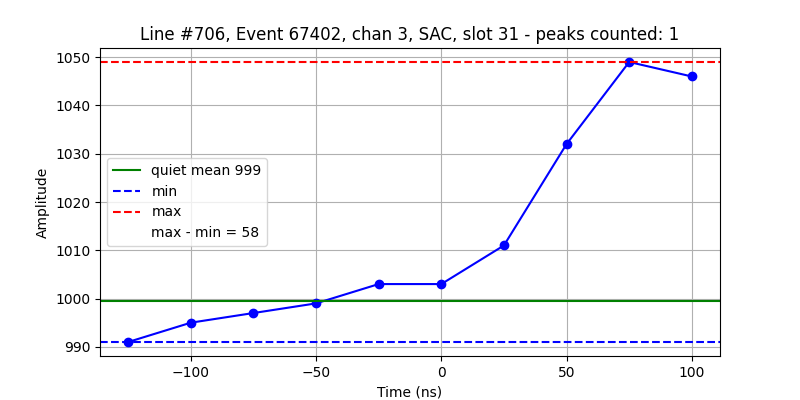
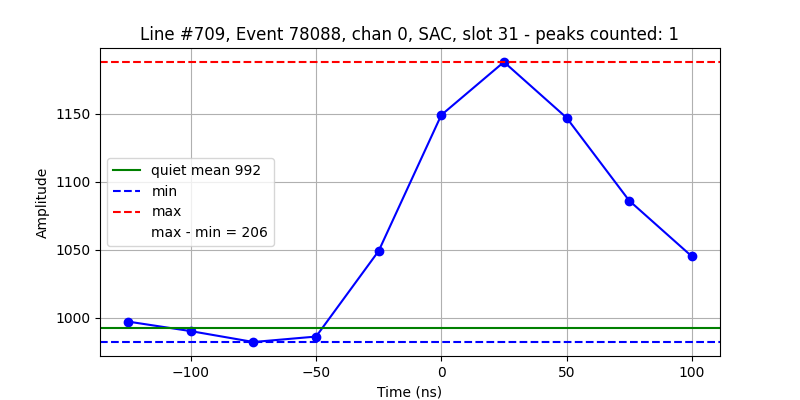
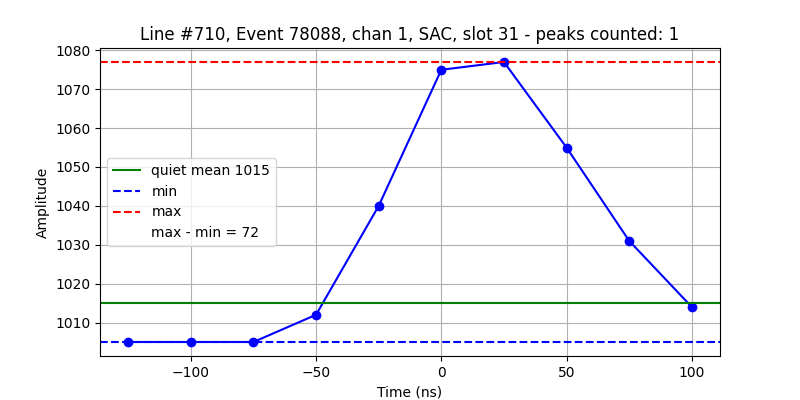
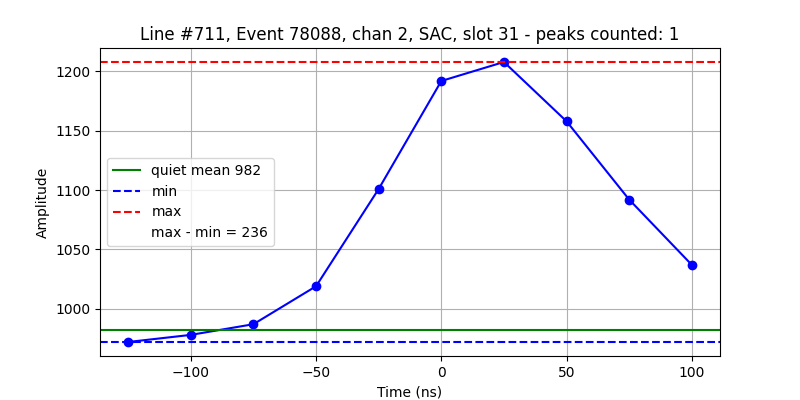
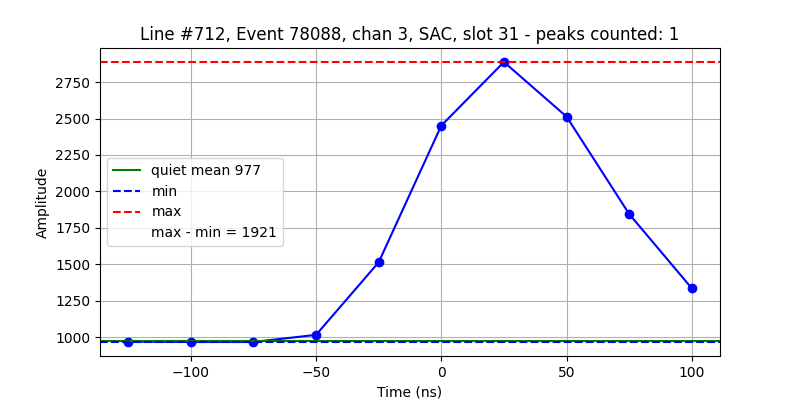
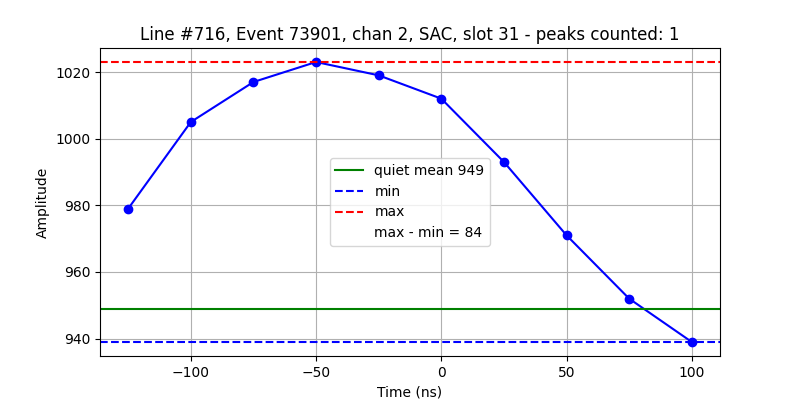
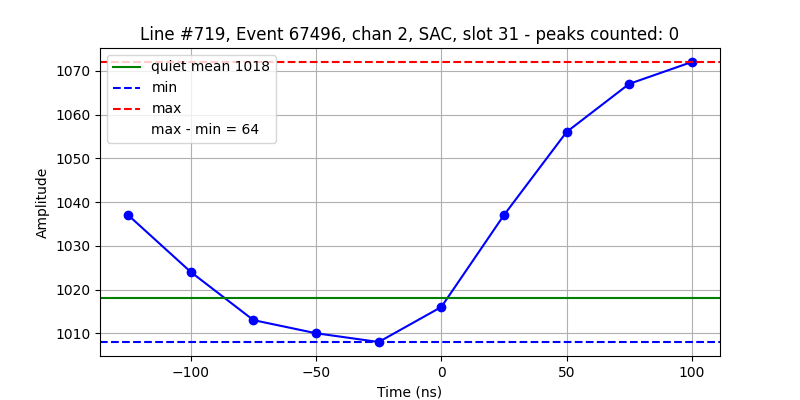
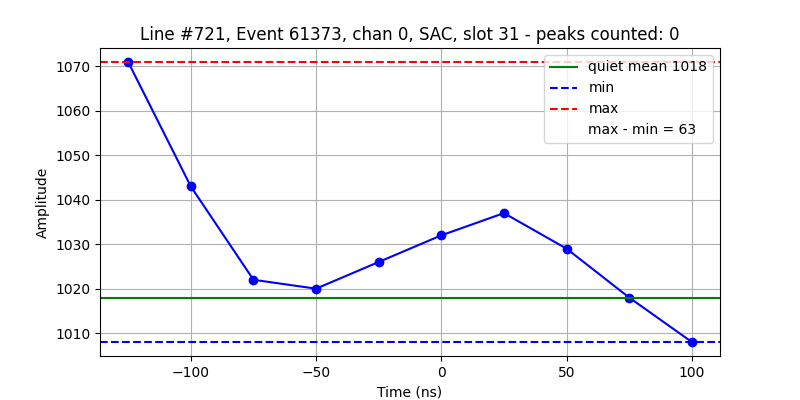
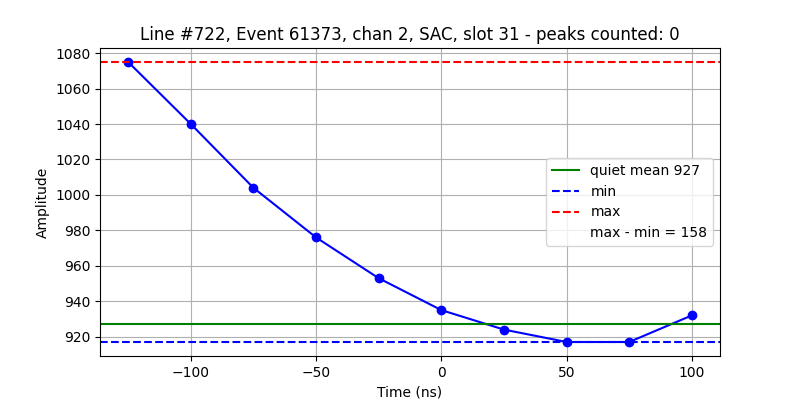
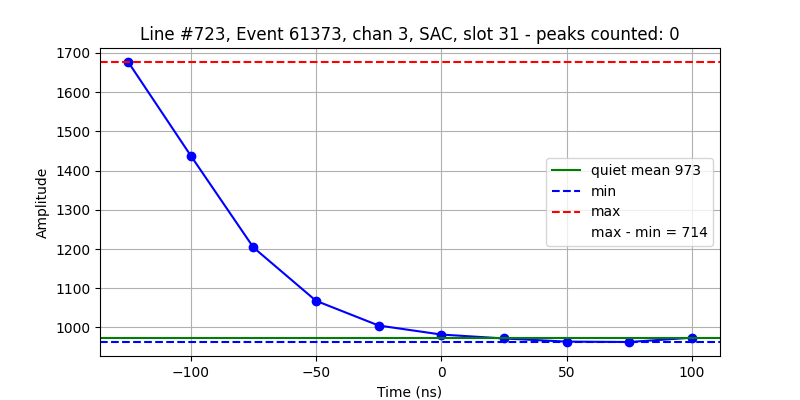


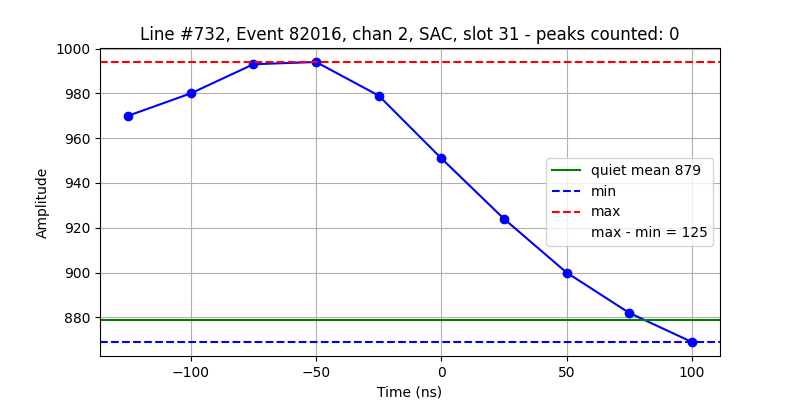
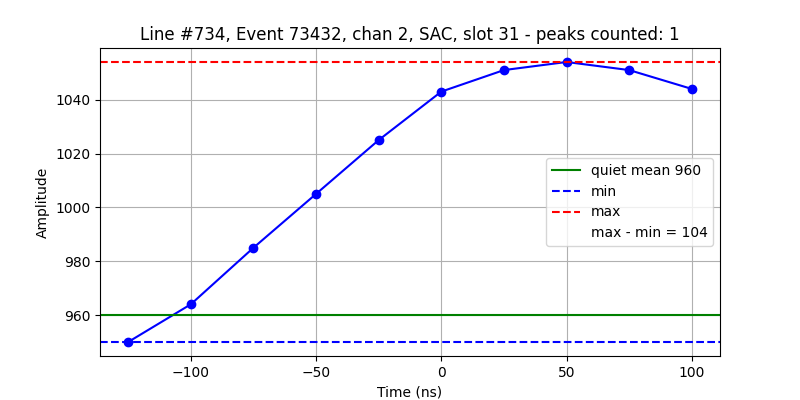

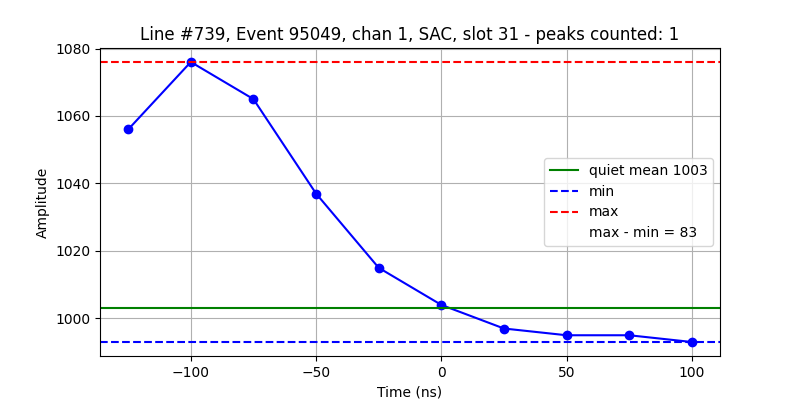

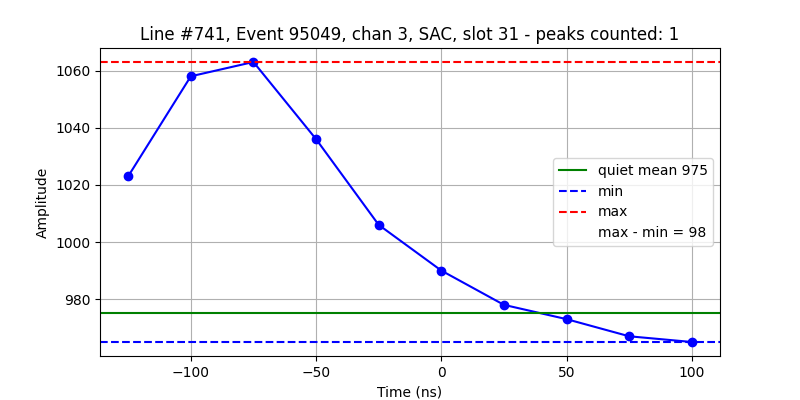
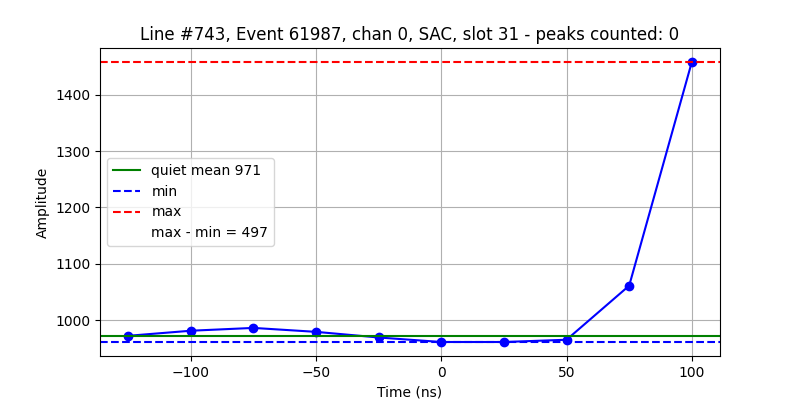
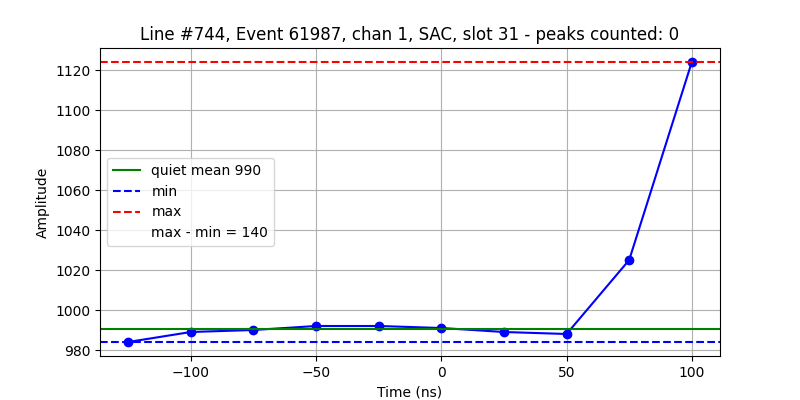
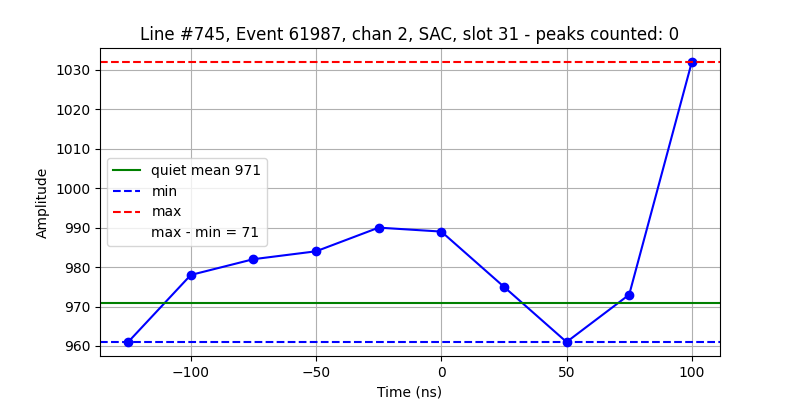

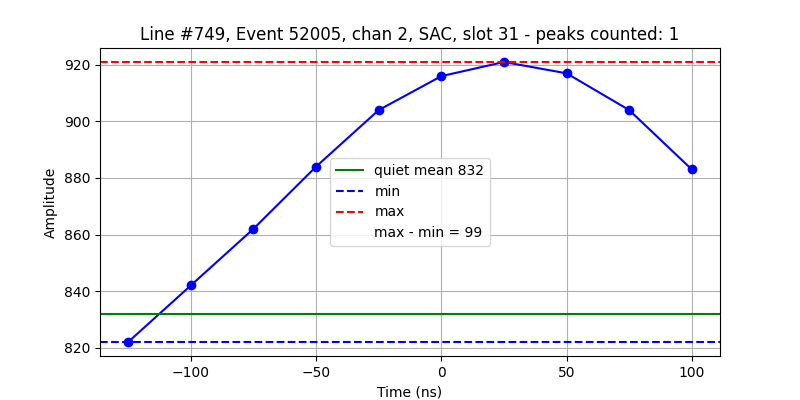
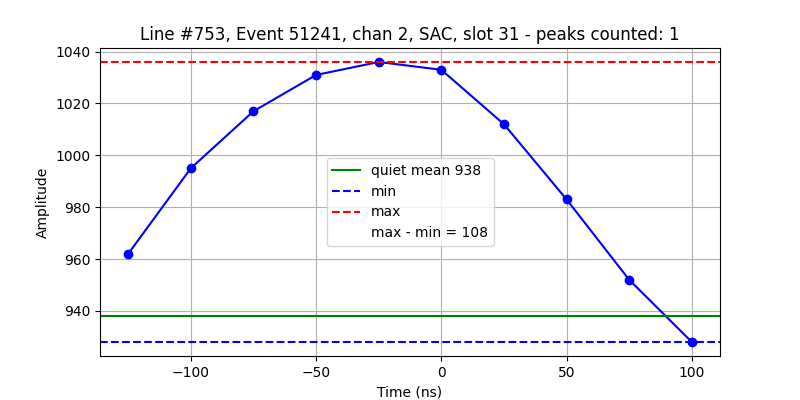

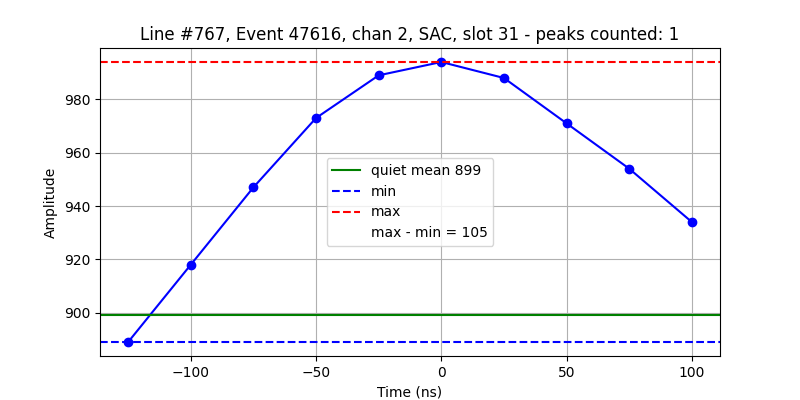
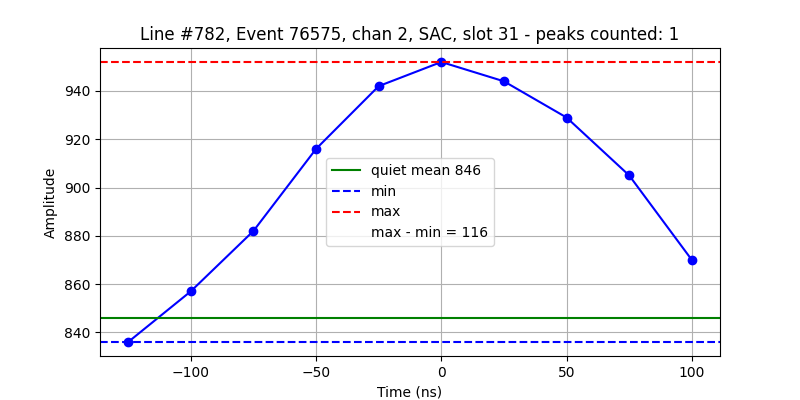
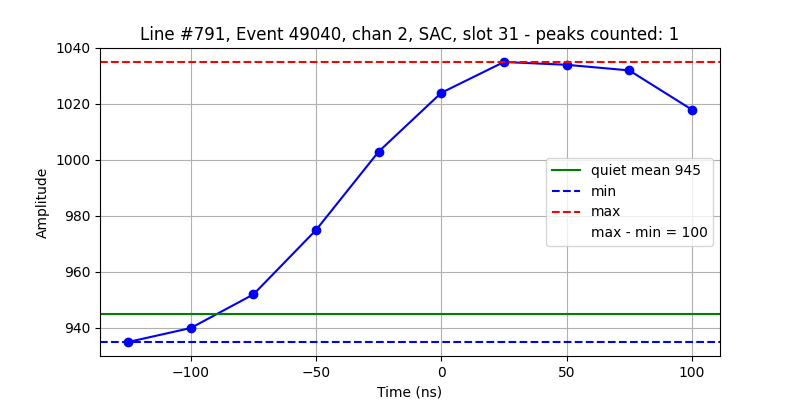
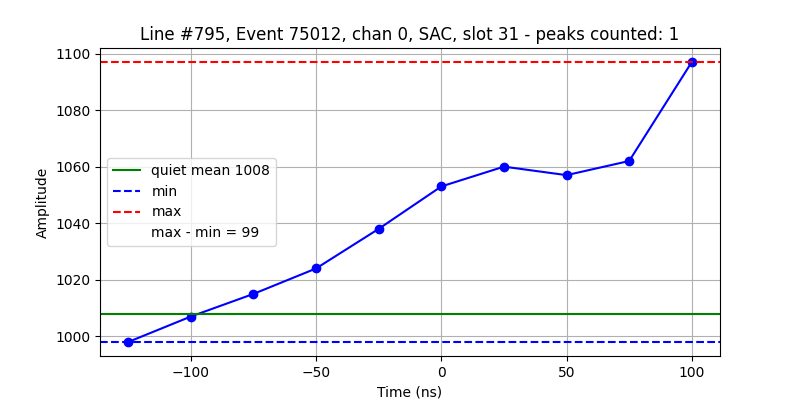
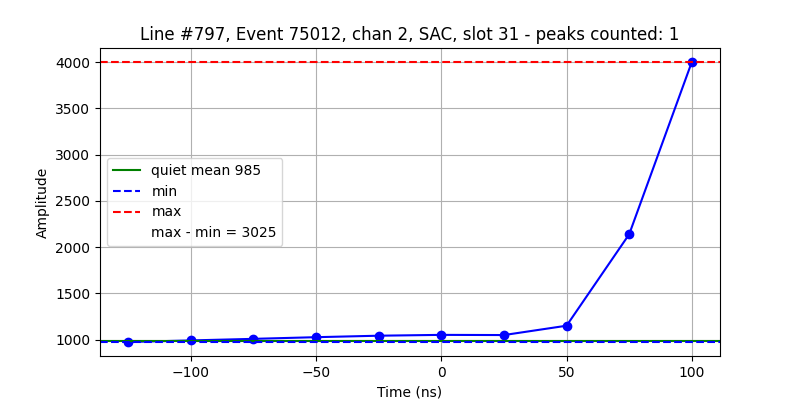
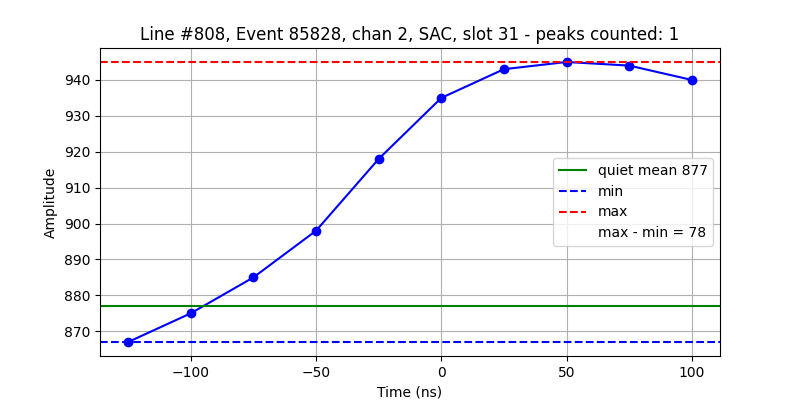
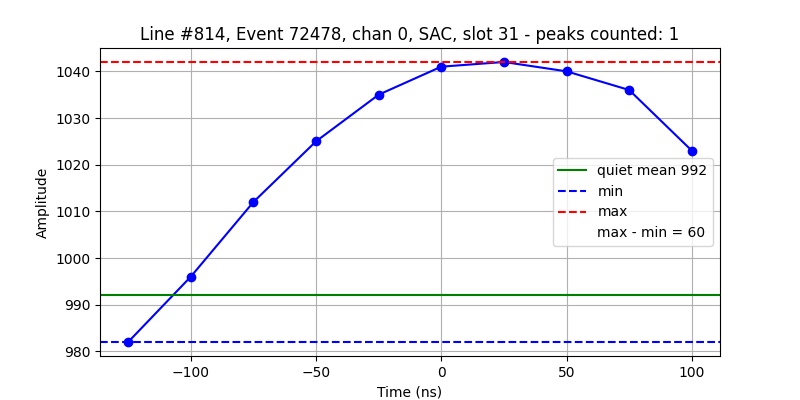
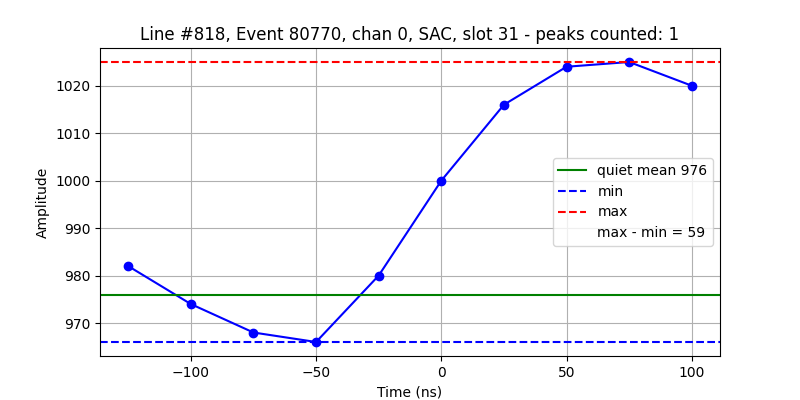
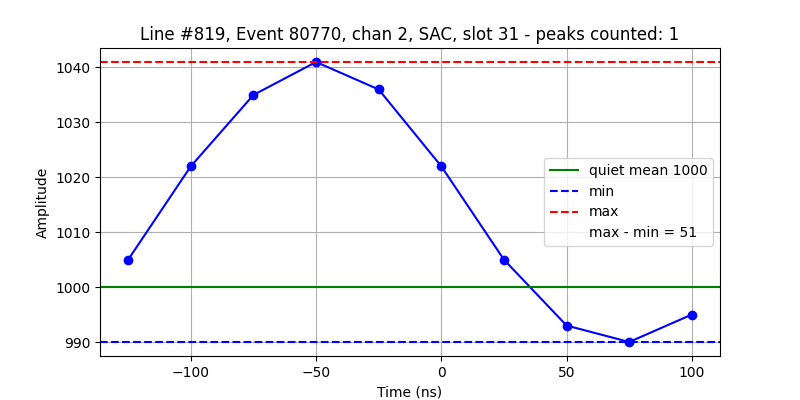
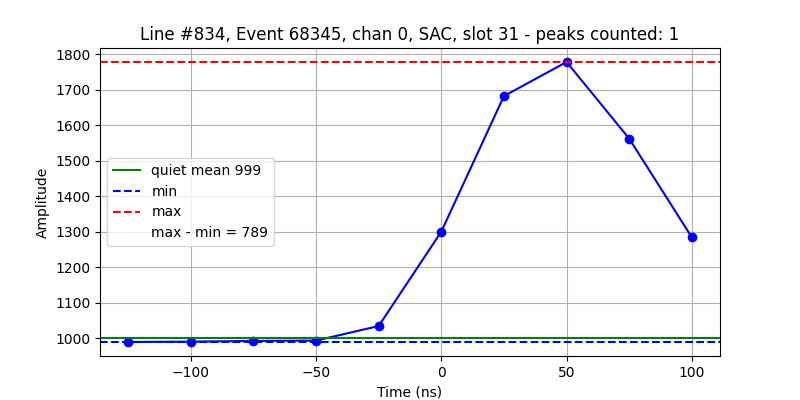
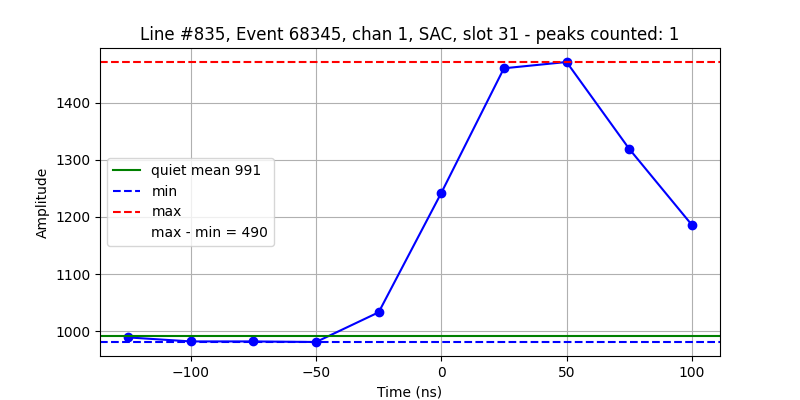
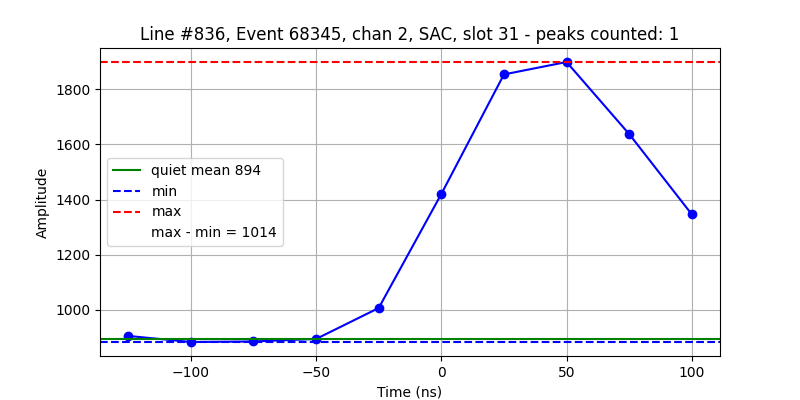
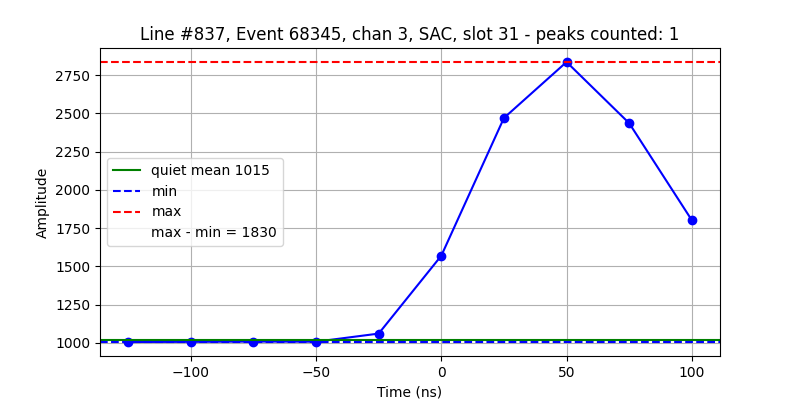
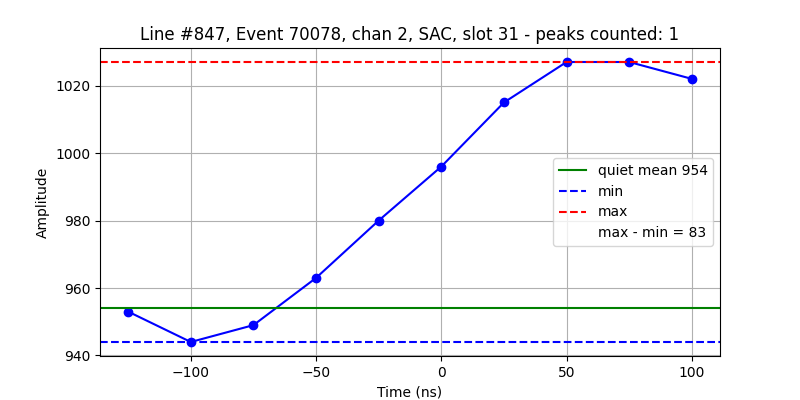
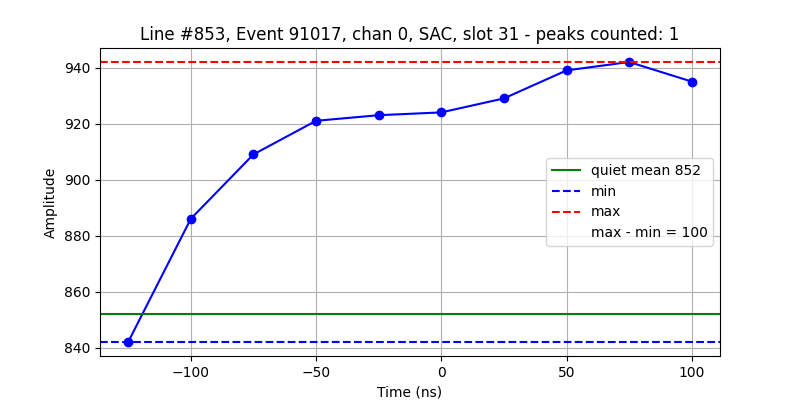
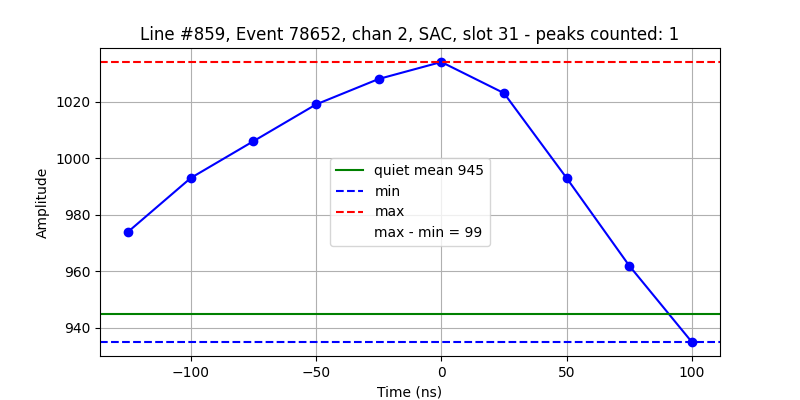

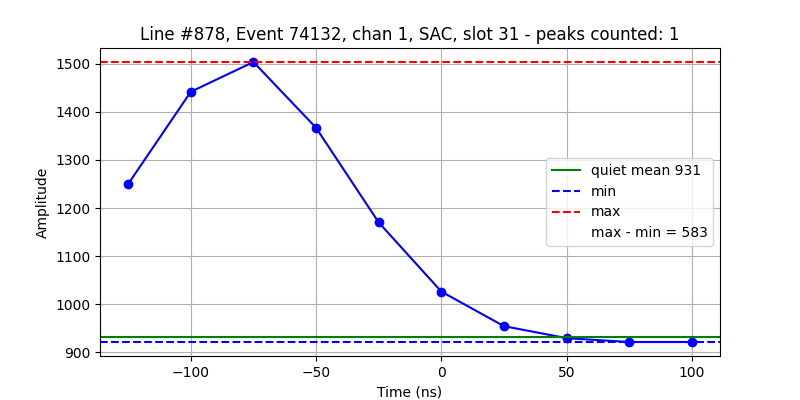
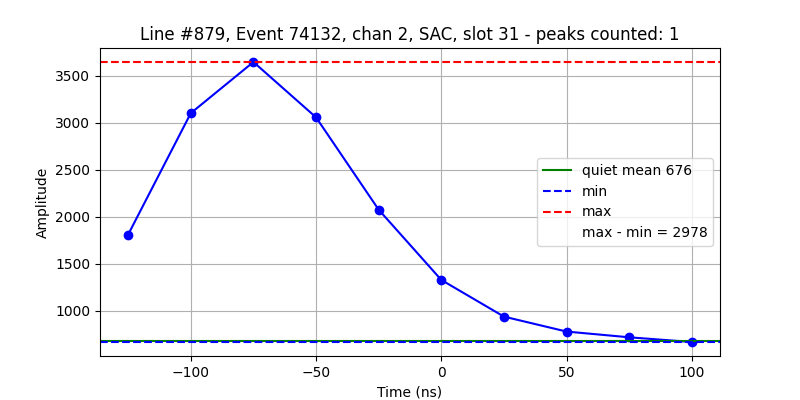

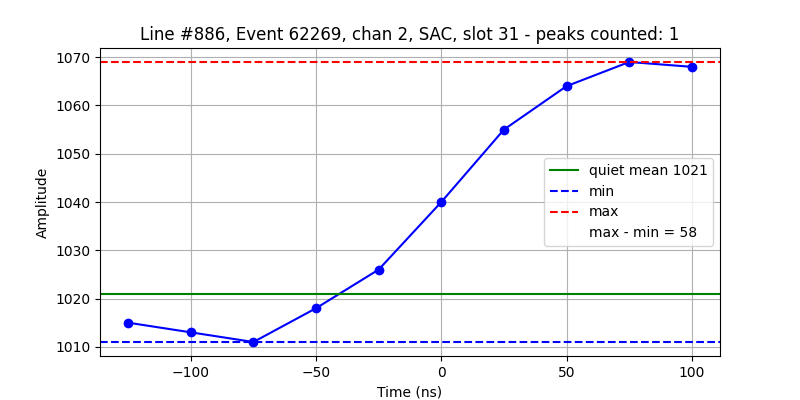

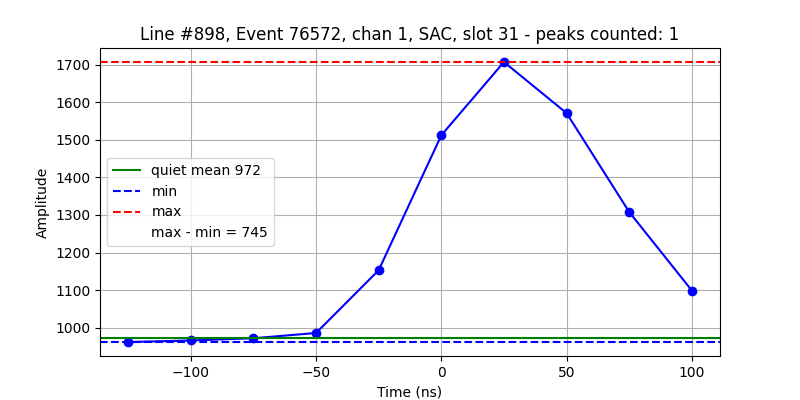

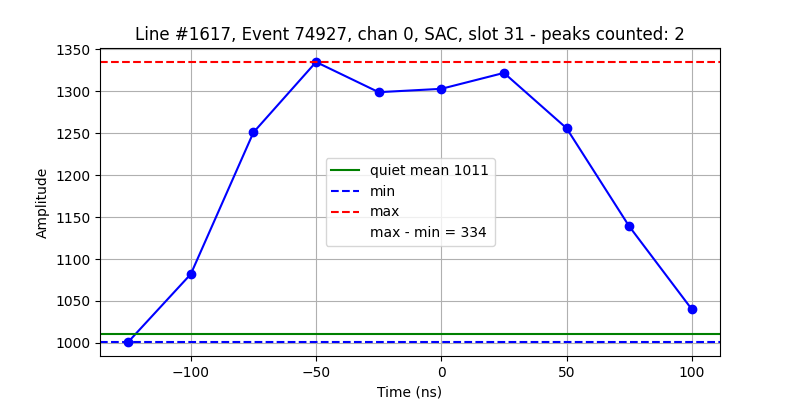

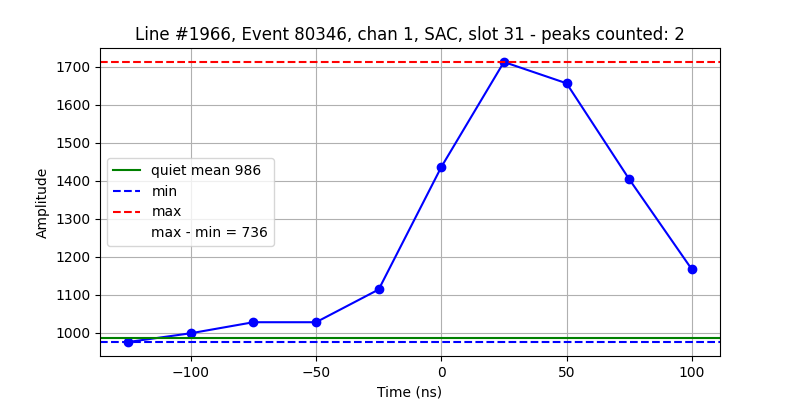
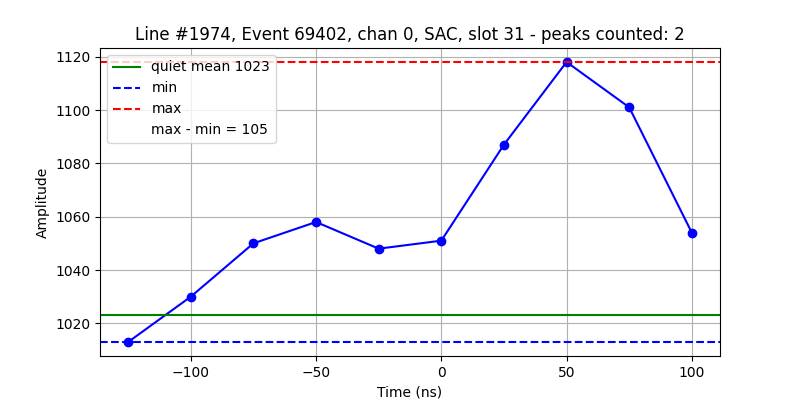


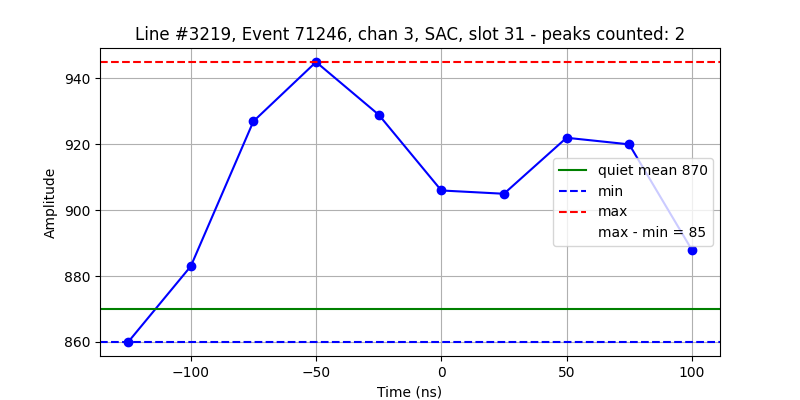
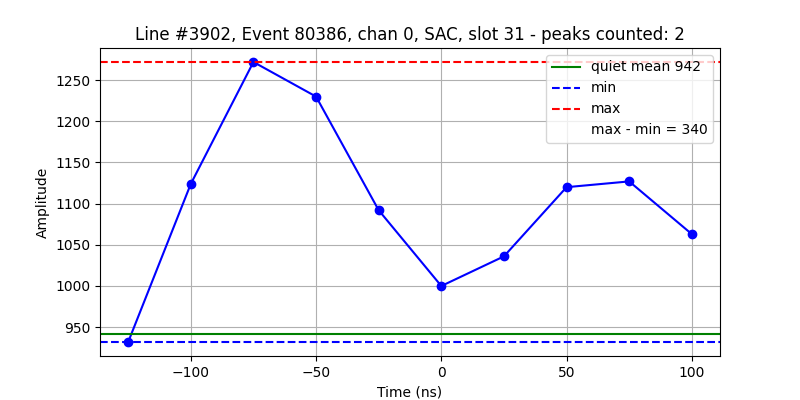
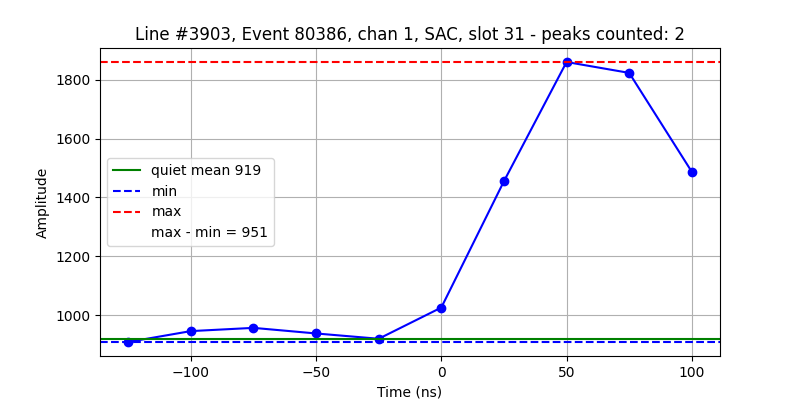
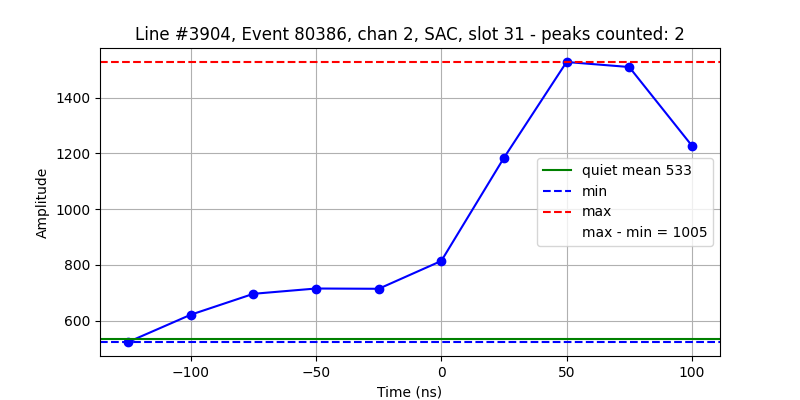
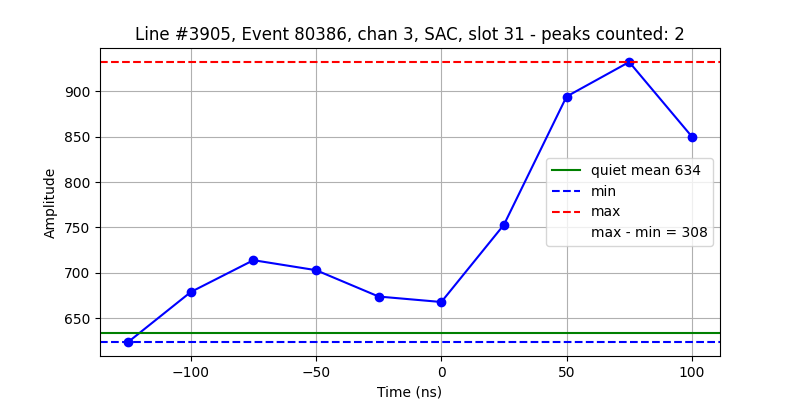
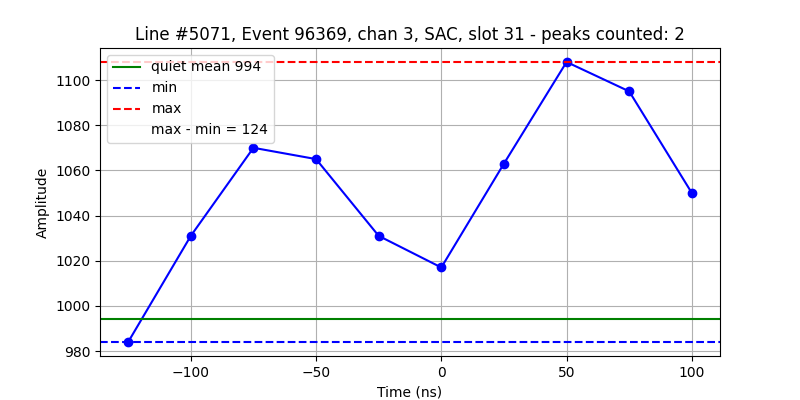

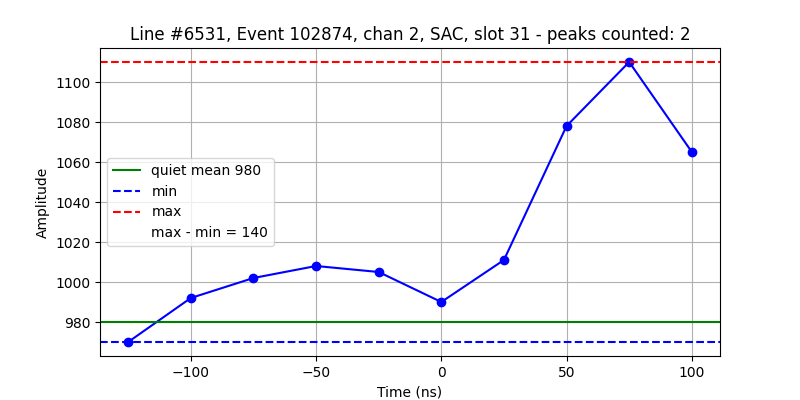

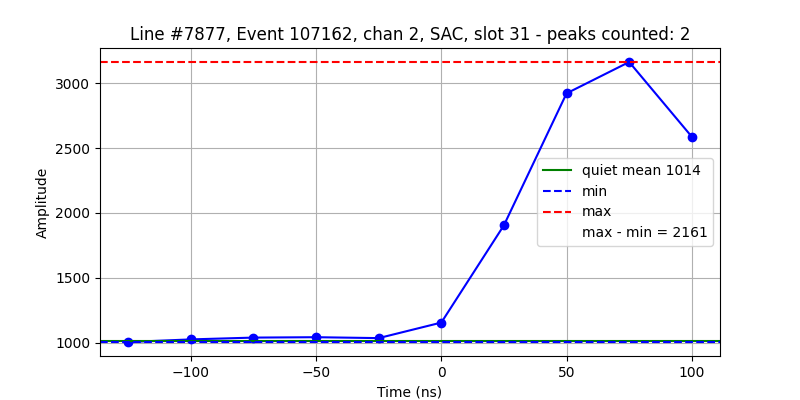
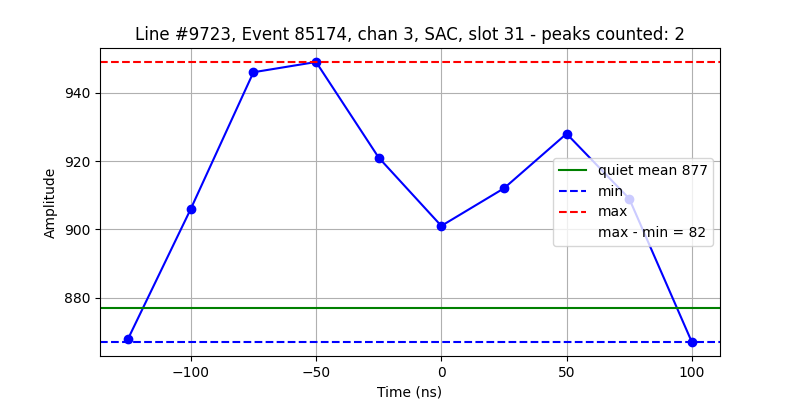
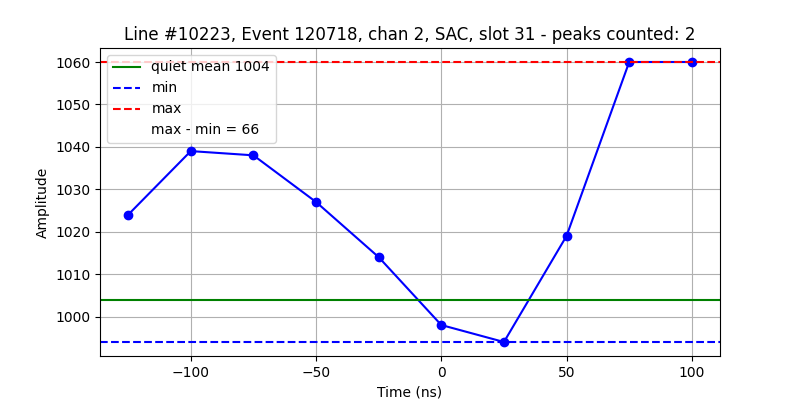
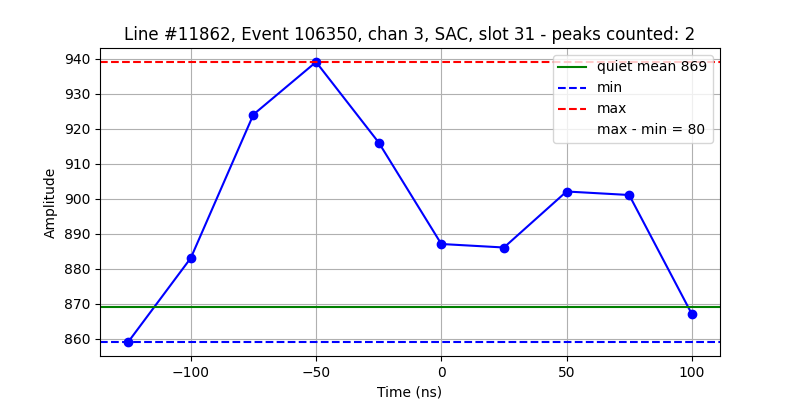
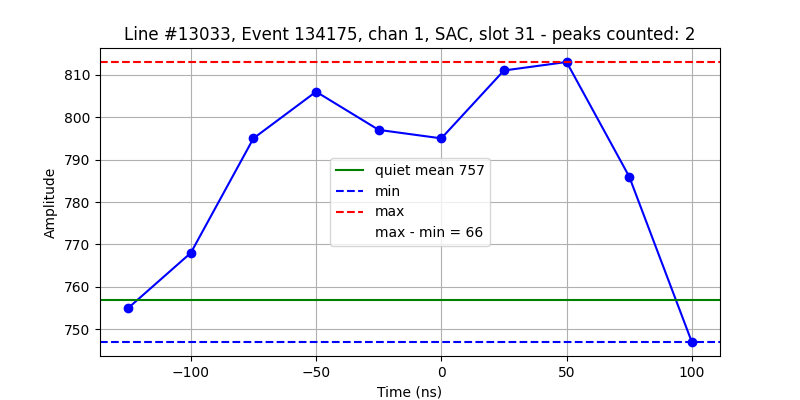
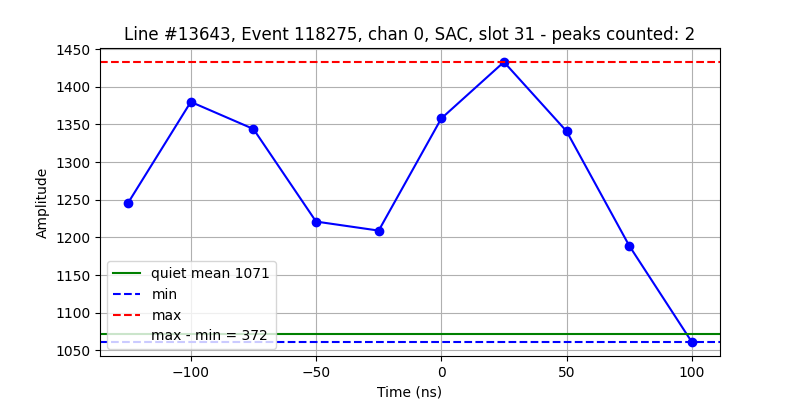
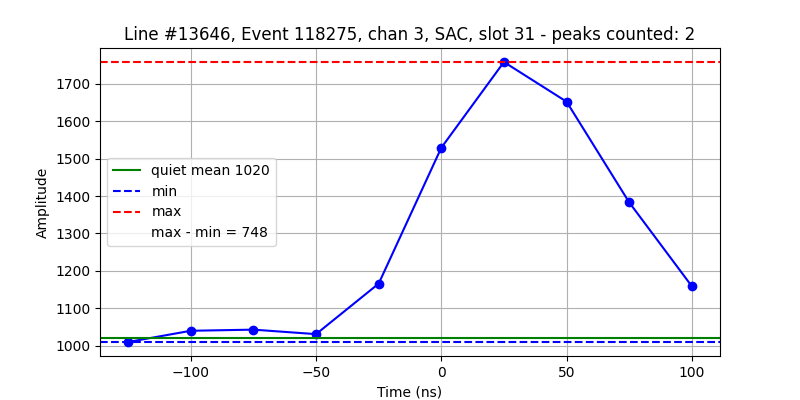
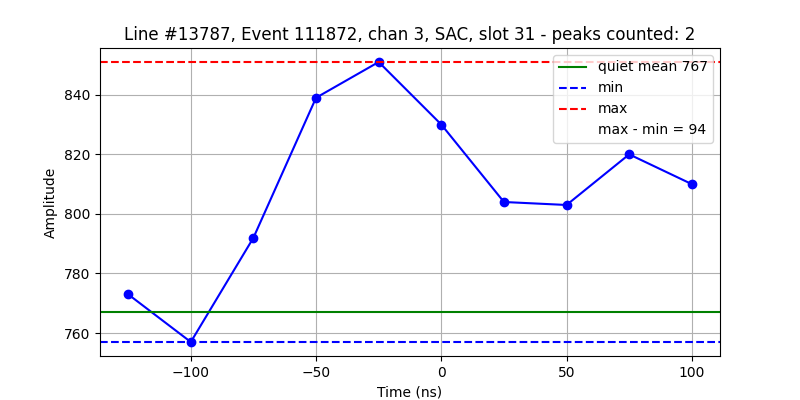
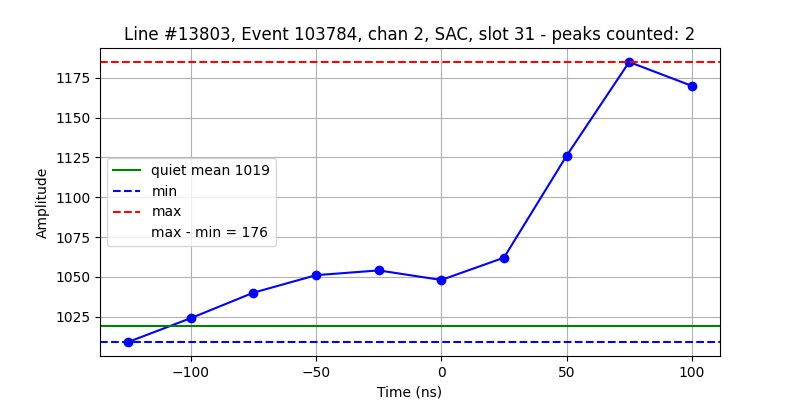
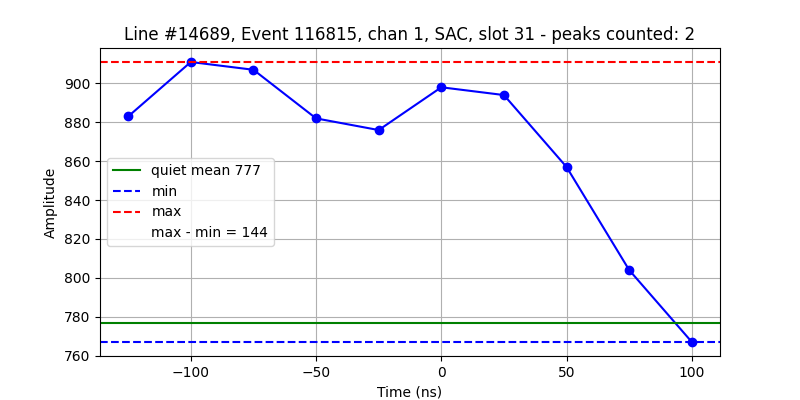


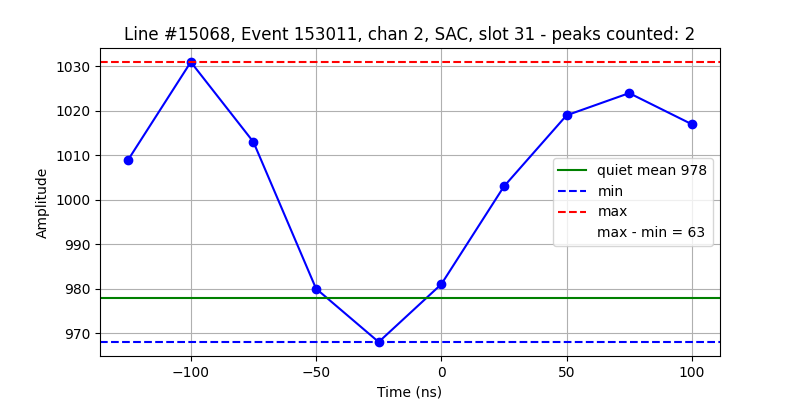
These plots were produced with the script graph_amplitudes.py, and (a small selection of) data points from samples.txt, used by the peak finding algorithm. To find how these datapoints are produced, or how the baseline, min, and max are calculated, see my modified C++ code in SAVReconstruction.cc.
Note that below is only a subset of 0, 1, and 2 peak pulses. Overall counts in samples.txt are: no peaks: 8366 occurrences (54.99%) 1 peaks: 6764 occurrences (44.46%) 2 peaks: 84 occurrences (0.55%) The line numbers refer to the samples.txt file.
The peak position and width histograms are preliminary, see code in scripts/.
Please use the scrollable thumbnails box to navigate, or go back to the main page. Select plots with 2 peaks, 1 peak, 0 peaks, all. Select detector IRC, SAC, both.