The question of the constituent content of the pomeron can also be addressed
via measurements of diffractively produced jets in the photoproduction
data [33]. Jets are reconstructed at large W (130< W < 270 GeV)
using the cone algorithm with cone radius 1 and ETjet > 8 GeV.
The diffractive
contribution is identified as a tail in the ![]() distribution
of these events above the
PYTHIA 5.7 [34] Monte Carlo expectation. In Figure 9(a) the measured
cross section is compared to various model predictions as a function of the
jet rapidity.
Comparison with the non-diffractive contribution estimated from
PYTHIA indicates a significant excess at lower values of
distribution
of these events above the
PYTHIA 5.7 [34] Monte Carlo expectation. In Figure 9(a) the measured
cross section is compared to various model predictions as a function of the
jet rapidity.
Comparison with the non-diffractive contribution estimated from
PYTHIA indicates a significant excess at lower values of ![]() .
Here, standard photon and proton parton distributions are adopted and
the overall scale, which agrees with the non-diffractive data normalisation,
is set by ETjet. Also shown are the predicted diffractive cross sections
from POMPYT using a hard (z(1-z)) quark, hard gluon or soft
((1-z)5) gluon where a Donnachie-Landshoff flux factor is adopted
and the momentum sum rule is assumed to be satisfied in each case.
Sampling low-energy (soft) gluons corresponds to a small cross section
and can be discounted,
whereas high-energy (hard) gluons and/or quarks can account for the cross
section by changing the relative weights of each contribution.
The
.
Here, standard photon and proton parton distributions are adopted and
the overall scale, which agrees with the non-diffractive data normalisation,
is set by ETjet. Also shown are the predicted diffractive cross sections
from POMPYT using a hard (z(1-z)) quark, hard gluon or soft
((1-z)5) gluon where a Donnachie-Landshoff flux factor is adopted
and the momentum sum rule is assumed to be satisfied in each case.
Sampling low-energy (soft) gluons corresponds to a small cross section
and can be discounted,
whereas high-energy (hard) gluons and/or quarks can account for the cross
section by changing the relative weights of each contribution.
The ![]() distribution for these events, where
distribution for these events, where ![]() is the
reconstructed momentum fraction of the interacting photon,
is peaked around 1, indicating that at these ETjet values
a significant fraction of events is due to direct processes where the
whole photon probes the pomeron constituents.
is the
reconstructed momentum fraction of the interacting photon,
is peaked around 1, indicating that at these ETjet values
a significant fraction of events is due to direct processes where the
whole photon probes the pomeron constituents.
We now have two sets of data, the DIS data [24] probing the
pomeron structure
at a scale Q and the jet data probing at a scale
of ETjet. Each probes
the large z structure of the pomeron with
the jet and DIS data,
predominantly sampling the (hard) gluon and quark distributions, respectively.
In Figure 9(b) the preferred momentum
fraction carried by the (hard) gluon, cg, is
indicated by the overlapping region of the jet (dark band) and DIS
(light band) fits to the data.
Considering the systematics due to the non-diffractive background, modelled
using the Monte Carlo models, a range of values consistent with
![]() can be estimated.
The result depends on the assumption that the cross sections for both sets
of data factorise with
a universal flux, characterised by the same value of
can be estimated.
The result depends on the assumption that the cross sections for both sets
of data factorise with
a universal flux, characterised by the same value of ![]() in this W range,
but does not assume the momentum sum rule.
in this W range,
but does not assume the momentum sum rule.
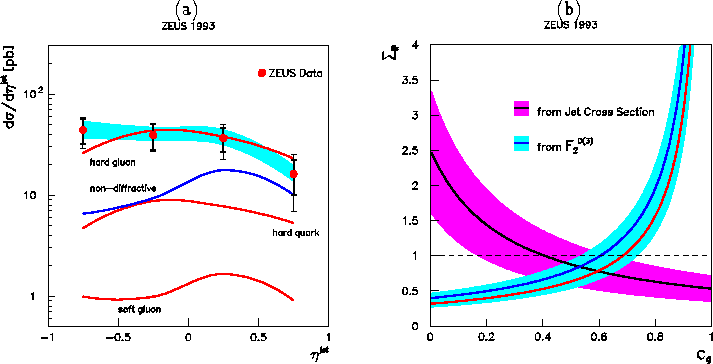
Figure 9: (a) Jet cross section as a function of jet rapidity for
events with ![]() . (b) Momentum sum rule assuming a
Donnachie-Landshoff flux,
. (b) Momentum sum rule assuming a
Donnachie-Landshoff flux, ![]() , versus the momentum fraction carried
by the gluons in the pomeron, cg. The dark (light) error bands correspond to
statistical errors on the fits to the jet (DIS) data discussed in the text.
, versus the momentum fraction carried
by the gluons in the pomeron, cg. The dark (light) error bands correspond to
statistical errors on the fits to the jet (DIS) data discussed in the text.
So far we have only considered the case of small-t diffraction with respect
to the outgoing proton. Further insight into the diffractive exchange process
can be obtained by measurements of the rapidity gap between jets. Here,
a class of events is observed with little hadronic
activity between the jets [35].
The jets have ETjet > 6 GeV and are separated by a pseudorapidity
interval ( ![]() ) of up to 4 units.
The scale of the momentum transfer, t, is not precisely defined but
is of order (ETjet)2.
A gap is defined as the absence of particles with
transverse energy greater than 300 MeV between the jets.
The fraction of events containing a gap is then measured as a function of
) of up to 4 units.
The scale of the momentum transfer, t, is not precisely defined but
is of order (ETjet)2.
A gap is defined as the absence of particles with
transverse energy greater than 300 MeV between the jets.
The fraction of events containing a gap is then measured as a function of
![]() , as shown in Figure 10.
The fit indicates the sum of an exponential behaviour, as
expected for non-diffractive processes and discussed in relation to the
diffractive DIS data, and a flat distribution expected for diffractive
processes. At
values of
, as shown in Figure 10.
The fit indicates the sum of an exponential behaviour, as
expected for non-diffractive processes and discussed in relation to the
diffractive DIS data, and a flat distribution expected for diffractive
processes. At
values of ![]() , an excess is seen with a constant fraction
over the expectation for non-diffractive exchange
at
, an excess is seen with a constant fraction
over the expectation for non-diffractive exchange
at ![]() .
This can be interpreted as evidence for large-t diffractive scattering.
In fact, secondary interactions of the photon and proton remnant
jets could fill in the gap and therefore the underlying process could play
a more significant rôle.
The size of this fraction is relatively large when compared to a similar
analysis by D0 and CDF where a constant fraction at
.
This can be interpreted as evidence for large-t diffractive scattering.
In fact, secondary interactions of the photon and proton remnant
jets could fill in the gap and therefore the underlying process could play
a more significant rôle.
The size of this fraction is relatively large when compared to a similar
analysis by D0 and CDF where a constant fraction at ![]() is observed [36, 37].
The relative probability may differ
due to the higher W values of the Tevatron compared to HERA or, perhaps,
due to differences in the underlying
is observed [36, 37].
The relative probability may differ
due to the higher W values of the Tevatron compared to HERA or, perhaps,
due to differences in the underlying ![]() and
and ![]() interactions.
interactions.
Figure 10: Gap-fraction, ![]() , as a function of the rapidity gap
between the two jets compared with the result of a fit to an exponential plus
a constant.
, as a function of the rapidity gap
between the two jets compared with the result of a fit to an exponential plus
a constant.