NA62 beam studies (1/11/22)
--------------------------
--------------------------------------------------------------------------------------------------------------
SPILL - poisson plots
Use kspill6 and kspillff
Fig 6a general test plot - kspill4.kumac reads 3 files
Uses heapsort. code bsed on kstamp - integer based.. kumac only
Fig 6b kspill5.kumac reads 3 files as kspill4 + additions FINAL 060123
Fig 6c kspill5dev.kumac reads 3 files as kspill4 + additions DEV
**************************************************************************************************************
**************************************************************************************************************
**************************************************************************************************************
**************************************************************************************************************
**************************************************************************************************************
Fig 6d kspill6.kumac new plots P1 for mean/variance + sample variance (20/2/23)
3/3/23 9 files gaussian for 1 ms limited range fit. prob gaussian. Best version 3/3/23.
**************************************************************************************************************
**************************************************************************************************************
**************************************************************************************************************
**************************************************************************************************************
**************************************************************************************************************
Fig 6dran kspill6.kumac new plots P1 for mean/variance + random sample variance (20/2/23)
Fig 6e kspill7.kumac as kspill6.kumac - minimal plots
**************************************************************************************************************
Fig 6f kspill8.kumac as kspill7.kumac - minimal plots +prob of gaussian
4 files. Now outdated (3/3/23) use kspill6.kumac : 9 files + 1 ms gaussia + sample variance tests.
**************************************************************************************************************
**************************************************************************************************************
**************************************************************************************************************
**************************************************************************************************************
**************************************************************************************************************
Fig 6g kspillff.kumac to kspillf.ps (pdf) for filter tests.
3/3/23 version: filter tests for 100 ms and 1 sec. Demonstrates effect of filtering
and shows the low frequency component.
**************************************************************************************************************
**************************************************************************************************************
**************************************************************************************************************
**************************************************************************************************************
Fig 6h kspillp.kumac , test periodogram 1 sec (kspillff derivative)
Fig 6h kspillp2.kumac , test periodogram + correlogram (kspillff derivative)
Fig 6h kspillp4.kumac , test periodogram * 4 (4 secs) (kspillff derivative)
Displays kspillp4m.kumac outputs kspillp4.pdf , uses modified periodogram that dispays amplitude( equiv autocprr10m.kumac)
--------------------------------------------------------------------------------------------------------------
--------------------------------------------------------------------------------------------------------------
AUTOCORR versions
Fig 11f autocorr7r.kumac - random time for test
in autocorr for spill and in input for FFT. 110123-v2 has sin(wt) for spill and FFT.
Gap for folded time.
Fig 11g autocorr8.kumac - DEV - has Hurst with log-log fit.
Fig 11G autocorr8a.kumac - DEV - has Hurst with log-log fit.
Possible bug removed in autocorr8a.kumac - arrays zeroed.
Fig 11f autocorr9.kumac - low frequency FFT
*******************************************************************************************
*******************************************************************************************
Fig 11g autocorr10.kumac - FFT minimal version
Updated to autocorr10m.kumac FFT with trend subtracted. (o/p to autocorr10.pdf) 04/03/23
*******************************************************************************************
*******************************************************************************************
***********************************************************************************************
Fig 11h autocorr11.kumac - FFT for 1 sec spill regions.
i**********************************************************************************************
--------------------------------------------------------------------------------------------------------------
--------------------------------------------------------------------------------------------------------------
FFT tests
Fig A fftplot1.kumac - FFT stand-alone
Fig B fftplot2.kumac - FFT stand-alone - low frequency.
Fig C fftplot3.kumac - FFT stand-alone - 3 files - low frequency
Fig D fftplot32.kumac - FFT stand-alone - 3 files - low + high frequency
Fig E fftplot1dev.f to cft.kumac - FFT stand-alone - cft version
Shows three plots for three intervals in spill. 100 Hz signal absent in second selected region.
-------------------------------------------------------------------------------------------------------------
--------------------------------------------------------------------------------------------------------------
Programs 05/02/23 CFT D702 tests
Fig Ea fftplot1dev.f to cft1.kumac - FT stand-alone - cft version -file 1
Fig Eb fftplot2dev.f to cft2.kumac - FT stand-alone - cft version -file 2
Fig Ec fftplot3dev.f to cft3.kumac - FT stand-alone - cft version -file 3
Fig E1 fftplot41.f to cft41.kumac - FT stand-alone - cft version -file 1
Fig E2 fftplot42.f to cft42.kumac - FT stand-alone - cft version -file 2
Fig E3 fftplot43.f to cft43.kumac - FT stand-alone - cft version -file 3
Fig Ed fft1test.f to cft1test.kumac - FFT stand-alone - cft version -file 1
test version
Fig Ed fft2test.f to cft2test.kumac - FFT stand-alone - cft version -file 2
test version
Fig Ed fft1test.f to cft3test.kumac - FFT stand-alone - cft version -file 3
test version
-------------------------------------------------------------------------------------------------------------
--------------------------------------------------------------------------------------------------------------
Simulation FFT + R/S
Fig 12 simulation, corrtest2.kumac - check autocorr , FFT
**************************************************************************************************************
**************************************************************************************************************
Fig 122 simulation, corrtest22.kumac - check autocorr , FFT, standard
periodogram. Set to show output from corrtest22m.kumac.
corrtest22m.kumac FFT + modified periodogram for f = 0 and amplitude.
corrtest22m.kumac to corrtest22.ps mod to give same results as FFT (09/03/2023 ). Use this version for tests.
Demonstrates:
Peak at f = 0, = number of input events
Peaks at f .ne. 0, = (0.5 * amplitude) of sin/cos terms.
Set to show 100Hz ( k = 5 )
Fig 12dd simulation of data, corrtestdd.kumac. structure as corrtest22m.kumac
Fig 12nn simulation of noise, corrtestnn.kumac.
**************************************************************************************************************
**************************************************************************************************************
Fig 12a simulation, corrtest3.kumac - check autocorr , FFT , Hurst R/S
Fig 12b simulation, corrtest4.kumac - check autocorr , FFT , Hurst + fit to log-log
*****************************************************************************************************************************
Fig 12bran simulation, corrtest41.kumac - random only check FFT , Hurst + fit to log-log
Comment: corrtest41.kumac is the only Hurst code that has been checked to agree with the literature.
It does not give the expect slope for log R/S vs log time.
*****************************************************************************************************************************
Fig 12c simulation, corrtest5.kumac - as corrtest4 , debug version
Fig 12d simulation, corrtest9.kumac - random only - for study/debug
Showing corrtest10.kumac for 5, 10, 15 Hz. Rerun corrtest9 for standard plots.
--------------------------------------------------------------------------------------------------------------
--------------------------------------------------------------------------------------------------------------
--------------------------------------------------------------------------------------------------------------
Fourier Transform - Python code
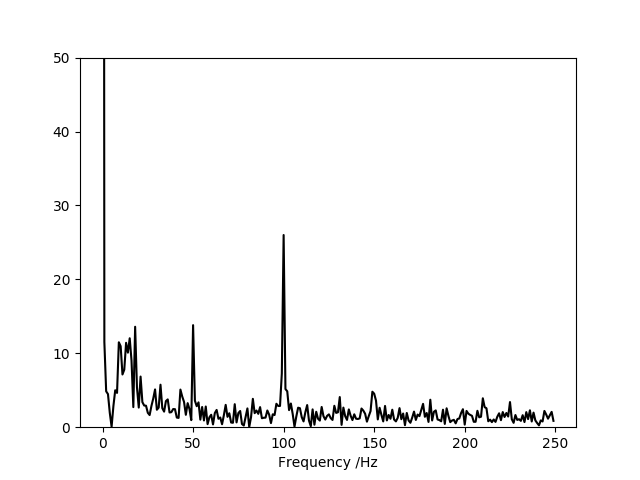
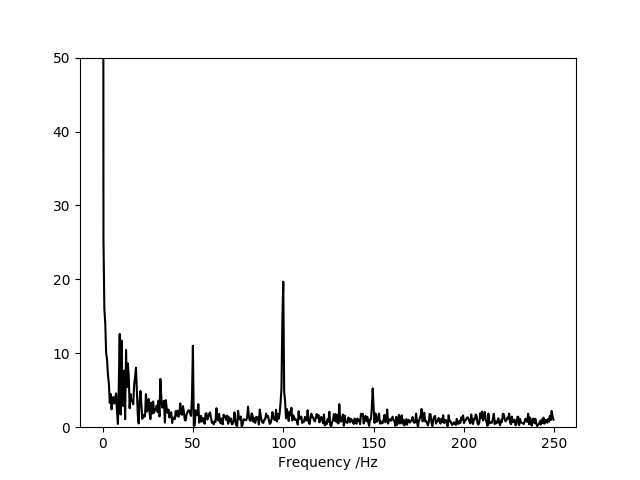
Fig 6 Fourier transform of spill (3 - 4 sec) 12465/170
Fig 7 Fourier transform of spill (3- 5 sec) 12465/170
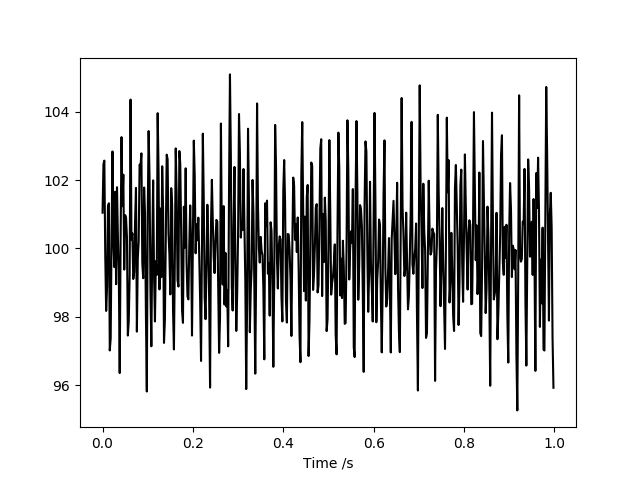
Fig 8 simulate 50, 100, 160 Hz spectrum (fftcode1.py ) 30/11/22
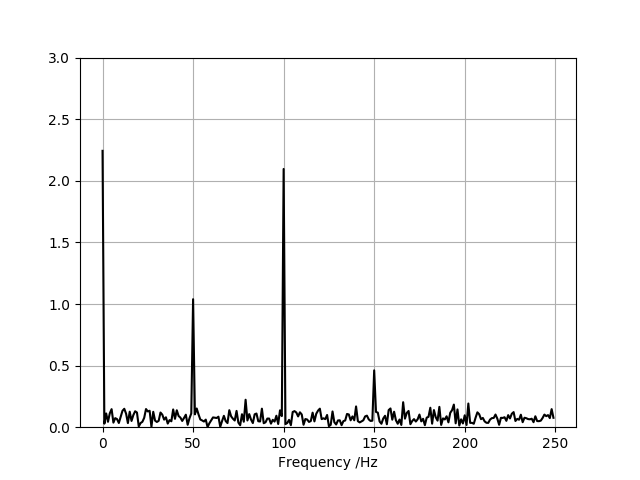
Fig 9 Fourier transform of simulation fig 8 (fftcode1.py) 30/11/22
--------------------------------------------------------------------------------------------------------------
--------------------------------------------------------------------------------------------------------------
--------------------------------------------------------------------------------------------------------------
plots in ~/public_html/newplots
