


Next: Estimates of the photon
Up: Performance of a Prototype
Previous: Alignment of the silicon
Simulation of the RICH-1 prototype
The RICH-1 prototype configurations are simulated to allow
detailed comparisons of expected performance with data. The
simulation is also used in the design of the prototypes themselves, to
calculate the optimal position of the detector plane from the
mirror. The program simulates photon emission in the radiators and
assigns each a wavelength, Cherenkov angle and point of
emission. Photons are then ray-traced to the HPD detectors
and assigned to a hit. The program incorporates the following physical
effects :
- Beam trajectory and composition :
For each event, an input beam direction and position is defined
according to the acceptance of the trigger scintillators. The input
particle is defined to be either a
 , e- or K- in ratios
of the real beam composition. The PS beam delivers particles
with a given, fixed momentum to within
, e- or K- in ratios
of the real beam composition. The PS beam delivers particles
with a given, fixed momentum to within  1%. The spread in
momentum is also included in the simulation.
1%. The spread in
momentum is also included in the simulation.
- Photon Generation and Chromatic Aberration :
Photons emitted in the radiator are assigned
an energy distribution ranging from 1.5 eV to 7.3 eV
according to the relation :

= 370 sin
2 L
L
where
 is the Cherenkov angle,
L is the radiator length in cm [4].
The dispersion of the refractive index
is parameterised in the simulation by the Lorentz-Lorenz
equation [6] :
is the Cherenkov angle,
L is the radiator length in cm [4].
The dispersion of the refractive index
is parameterised in the simulation by the Lorentz-Lorenz
equation [6] :
n(E)2 = 
|
(1) |
where :
c =  = 0.3738 cm3 = 0.3738 cm3 |
|
|
(2) |
f (E) =  + +  |
|
|
(3) |
and  is the density of the medium, M is molecular weight,
E is the photon energy and F and G are Sellmeir
coefficients. The latter are derived quantities, examples of which
are tabulated in reference [7]. In the simulation, air is
approximated by nitrogen, aerogel by quartz [4]
(scaled by their relative densities) and
C4F10 by
C2F6 [8] scaled to fit measured
data [9]. Figure 8 shows the simulated
behaviour of the refractive indices for aerogel and
C4F10 with respect to the wavelength of the emitted photon.
Finally, the Cherenkov angle is generated with a uniform azimuthal
angular distribution.
is the density of the medium, M is molecular weight,
E is the photon energy and F and G are Sellmeir
coefficients. The latter are derived quantities, examples of which
are tabulated in reference [7]. In the simulation, air is
approximated by nitrogen, aerogel by quartz [4]
(scaled by their relative densities) and
C4F10 by
C2F6 [8] scaled to fit measured
data [9]. Figure 8 shows the simulated
behaviour of the refractive indices for aerogel and
C4F10 with respect to the wavelength of the emitted photon.
Finally, the Cherenkov angle is generated with a uniform azimuthal
angular distribution.
Figure 8:
Parameterisations of the refractive index of aerogel and
C4F10 versus photon wavelength, as used by the
simulation program described in the text. Datapoints shown are
from [9].
 |
- Emission Point & Beam Trajectory Uncertainty :
In the LHCb RICH-1 counter, the mirror
is split and tilted to direct the ring images out
of the detector acceptance [1]. This introduces a photon
emission point error. When reconstructing
the Cherenkov angle, it is necessary to assume an emission point for
the photons, which is taken to be the mid-point of the radiator.
The beam trajectory uncertainty is assumed to be either determined by
the trigger scintillator acceptance in the absence of the silicon
telescope, or that determined by the silicon telescope pixel size and
the nominal (0, 0, - 1) simulated beam direction is smeared accordingly.
- Ray tracing : Each photon is individually traced
through the prototype geometry. The photon trajectory is modified by
refraction at the gas/aerogel boundary, reflection from the mirror
surface, absorption by the walls of the chamber or Rayleigh scattering
in the aerogel. The chromatic dependence of the mirror reflection and
transmission properties of the aerogel are used as measured, and are
shown in
Figures 3(b) and 3(d).
- Simulation of the HPD :
The quantum efficiency of the HPD photocathode, as a function of
photon wavelength, is supplied by the manufacturer and shown in
Figure 3(c). From these data the simulation determines
whether a photoelectron is produced. The simulation incorporates an
18% probability of a back-scattered electron being released from the
silicon [10]. If a back-scattered electron is
released, its flight path is calculated, assuming a uniform
accelarating field of the HPD, and its new hit position
recorded. Random electronic noise is also added to agree
with observations in data.
- Pressure Variation of the Gas Radiator :
The C4F10 gas recirculation system controls the pressure to
approximately
20 mbar which leads to a periodic variation in the
measured Cherenkov angle of approximately 0.7 mrad. This variation
can be reduced substantially by deactivating the circulation system.
This effectively decreases the rate of change of pressure, and allows
measurements to be made over longer periods of time with greater
stability.
An event display program is used to visualise the results of
simulation and data events. An example of simulated events in RICH Configuration 2 is shown in Figure 9.
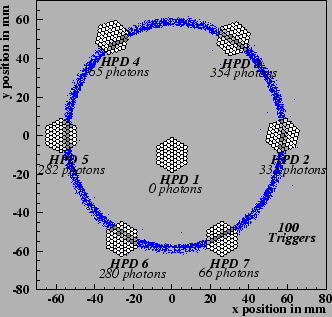
Figure 9:
Event display showing the superposition of
simulated events as in Configuration 2. The x and y axes are in
units of mm.
 |
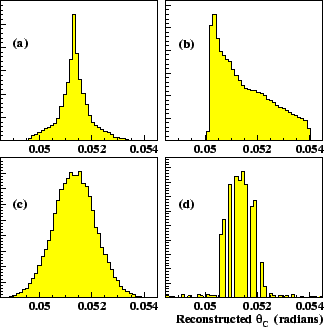
Contributions to the Cherenkov angle resolution for RICH Configuration 2 with a C4F10 gas radiator are shown in
Figure 10. Assuming an emission point for the
photons to be the mid-point of the radiator induces a
systematic contribution to the Cherenkov angle resolution shown in
Figure 10(a). The effect of chromatic aberration is
to induce a spread in the reconstructed values of
,
and this contribution is shown in Figure 10(b). If
in the reconstruction it is assumed that the beam particle follows the
nominal trajectory, this results in an additional contribution to the
Cherenkov angle resolution shown in Figure 10(c).
Finally, the finite pixel size (
2 x 2 mm2) affects the
reconstructed Cherenkov angle, as indicated in
Figure 10(d). Here the precise nature of the
modulation of the
distribution depends critically on
the relative orientations of the Cherenkov ring relative to the line
of the pixels in the HPD hexagonal structure. The effects of
this contribution are simulated, however the precise alignment of the
photon detectors relative to the ring remains a potential source of
discrepancy between data and simulation. Results are averaged over
compatible HPDs, in different orientations, in order to minimise
this uncertainty.
Figure 10:
Plots showing examples of
reconstructed
C4F10 Cherenkov angles when different
contributions to the error are isolated in the simulation: (a) Emission
point uncertainty only; (b) Chromatic aberration of the photons; (c)
the particle position and direction uncertainty and; (d) the error due
to the finite pixel size of
2 x 2mm2.
 |
The magnification of the incident position of photons arriving at the
photocathode is measured to be 1.06 from laboratory studies using a
scanning LED, and is included in the simulation. Finally,
background signals from electronic noise are included in the
simulation by smearing the expected photoelectron signal with a
Gaussian whose sigma is determined by the pedestal width observed in
data.
Next: Estimates of the photon
Up: Performance of a Prototype
Previous: Alignment of the silicon
latex2html conversion by www person on 2000-01-23